All illustrations on the ECG Guru website are FREE for you to use in a teaching application and are COPYRIGHT FREE for such use. If you need an illustration for your packets or presentations, and don't find it here, contact the ECG Guru staff at [email protected]. For commercial use, contact us at the same email address. Click on illustration to open.
All our content is FREE & COPYRIGHT FREE for non-commercial use
Please be courteous and leave any watermark or author attribution on content you reproduce.


Comments
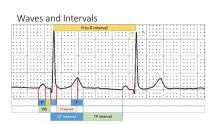
User-Friendly Review of the 3 KEY ECG Intervals!
For those desirous of an EASY method Review of the 3 major Intervals ( = PR, QRS, QT) — Please check out my Basic Concepts: ECG Blog 89 —
Ken Grauer, MD www.kg-ekgpress.com [email protected]
ST segment
I've always assumed that the ST segment ends where the T wave begins. Am I wrong?
Dave R
I may be wrong, but ...
Hi, Dave. I was always taught that the ST segment ends at the peak of the T wave because the gradual slope of the ST segment prevents us from identifying an exact point where the T wave begins. I never really gave it a lot of thought because I was focused on the J point (for elevation and depression) and the overall shape of the ST segment (which often is altered all the way up to the T wave peak. Since we don't measure the duration of the ST segment, but rather the QT interval, this question just never came up before. I welcome any and all comments, and if I am wrong, I will be glad to find out and correct my thinking. Thanks for your comment.
Dawn Altman, Admin
My Thought: Where the ST Segment Ends and the T Wave Begins ...
Ken Grauer, MD www.kg-ekgpress.com [email protected]
ST segment contd.
I agree that it's often difficult to define the end of the ST segment but I think that concepts such as horizontal, upward-sloping or downward-sloping ST depression only make sense if we are referring to the bit of ECG between the end of the QRS and the start of the T wave, since the T wave is usually upward sloping at the start. I think it's helpful conceptually to separate the ST segment from the T wave even if it is often difficult to do in practice.
Dave R