Dawn's picture

We originally published this ECG in 2012.  It was generously donated to the ECG Guru website by our friend and ECG Guru Extraordinaire, Jason Roediger.  We are re-publishing it today, as it is a great ECG for illustrating how helpful laddergrams can be for showing conduction in dysrhythmias.

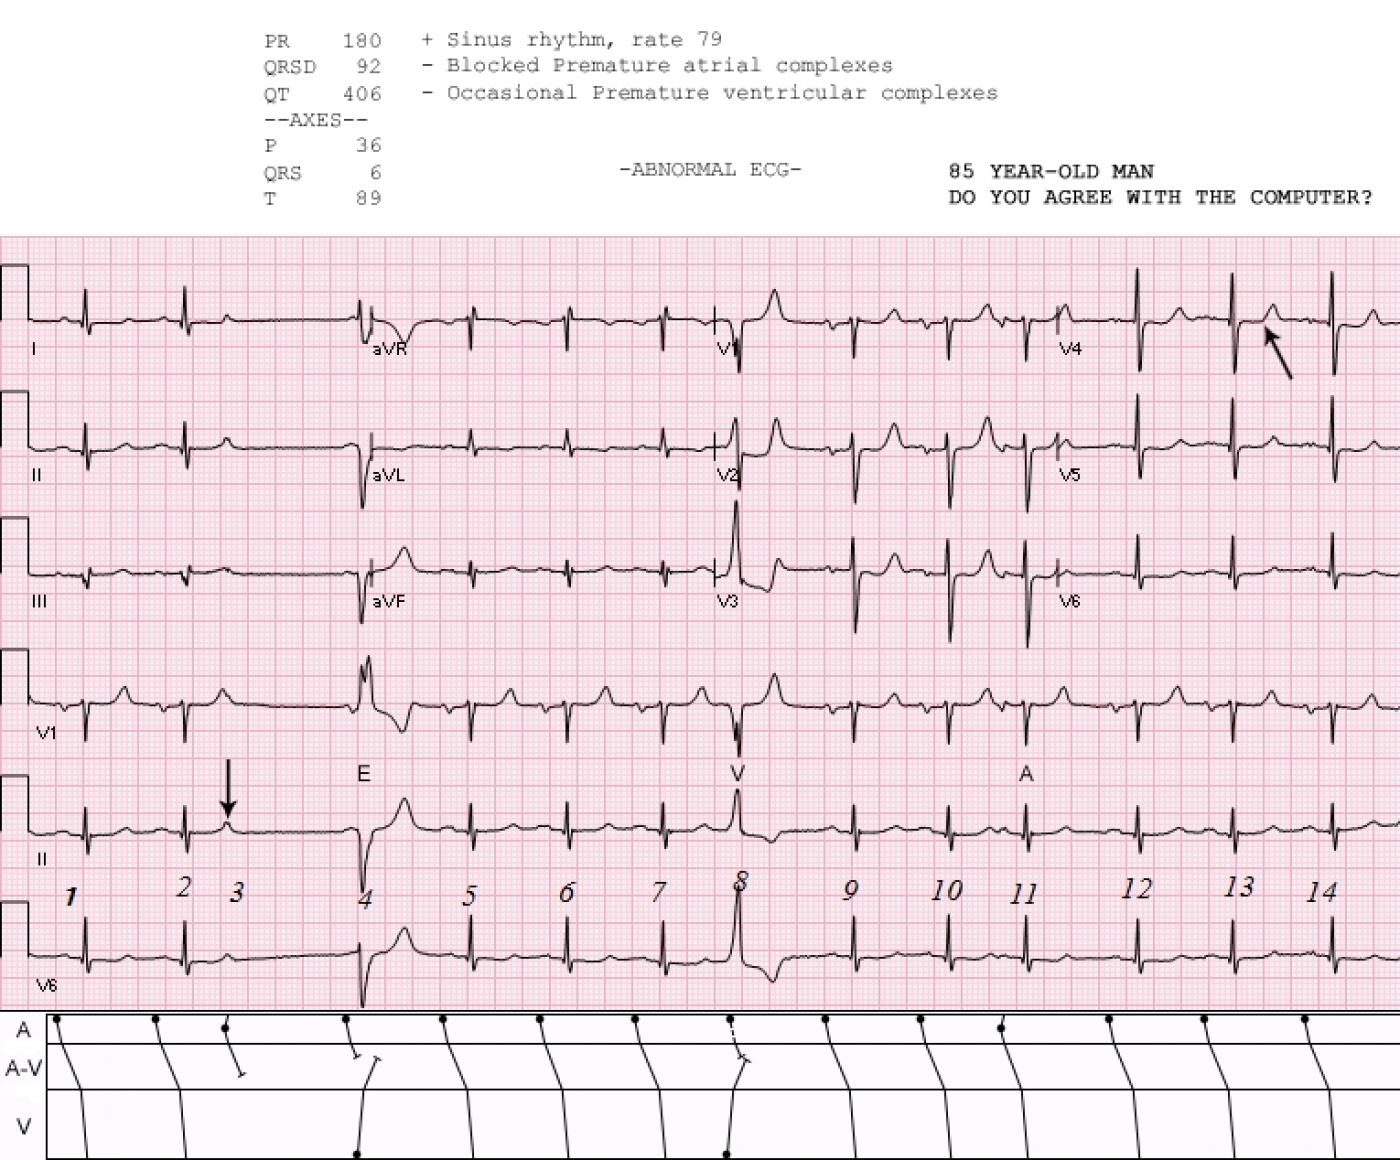
This ECG has something for everyone:  The rhythm is sinus, and there is a non-conducted PAC (beat number 3) after the second beat.  Just after the next P wave, there is a ventricular escape beat which prevents that P wave from making a QRS.  The eighth beat is a PVC.  The eleventh is a conducted PAC.  You can use this ECG to illustrate for your students the concepts of "escape" beats, refractory periods, and premature beats.

There are ST changes that suggest coronary artery disease: the ST segments are flat in shape with a tiny amount of elevation in V1 through V4.  The axis is normal, at the border of normal and left axis. It is difficult to see, but there appears to be a tiny r wave in Lead III, so we cannot say for sure if there is or was a pathological Q wave in that lead.

The P waves are wide and "double" in Lead II and biphasic in V1, suggesting LV failure or mitral valve disease.  However, the criteria for LV hypertrophy are not met.

Rate this content: 
Average: 3.1 (14 votes)

Comments

ekgpress@mac.com's picture


Excellent teaching tracing + laddergram posted this week by Dawn (with acknowledgment to Jason Roediger for allowing us to circulate his work). I LOVE this tracing as an example of how helpful Laddergrams can be in illustrating a number of common ECG arrhythmia elements. The KEY for understanding what information is conveyed by Laddergram is to appreciate: i) that there are 3 Tiers = A, A-V and V (corresponding to passage of the impulse through the Atria, AV Node and Ventricles); and ii) that the parameter of TIME occurs along the horizontal axis. Ideally (as happens here) — events on the Laddergram temporally correspond to events on the long lead rhythm strips that appear below the 12-lead ECG. Keeping these 2 points in mind, we emphasize the following about the Laddergram shown here:
  • Beats # 1,2,5,6,7,9,10,12,13 and 14 are all normal sinus beats. Note that conduction for each of these beats begins at the very top of the Atrial Tier (small black circle corresponding to the SA Node). Conduction is fast through the Atrial Tier (nearly straight vertical lines in the A Tier for all of these beats) — and, fast through the Ventricles — but, comparatively SLOW through the AV Node (which is why the slope of the slant in the vertical line thru the AV Node is slower for each of these normal sinus beats).
  • Beats #3 and 11 are PACs. Note that the small black circle occurs in the middle of the A Tier instead of at the very top — which makes sense, because a PAC arises from a different site within the atria. Note that the small black circle occurs first (ie, to the left) — and is then followed by a very short slanted line moving away from it directed toward the top of the A Tier (ie, conducting backward throughout the atria) — as well as by a slanted line moving forward as the impulse is conducted toward the AV Node.
  • NOTE: Sometimes the original of the impulse for normal sinus beats is implied. In such cases — a small black circle might not be drawn in at the top of the A Tier for normal sinus beats. However, a small circle should always be drawn in within the middle of the A Tier for PACs (as it is here for beats #3 and 11).
  • Beat #3 is a blocked PAC, since it is NOT followed by any QRS complex (1st black arrow in this tracing). We schematically illustrate this by showing that the vertical line for beat #3 passing through the AV Node does NOT arrive at the ventricles …Technically, we have no idea of how deep within the AV Node this PAC has penetrated. This doesn’t matter, because the important point is that it does not arrive all the way to the ventricles. It is up to the laddergram designer to arbitrarily decide on how far to draw this vertical line within the AV Node.
  • In contrast — beat #11 (A in the Figure) DOES arrive in the ventricles (since this PAC is followed by a QRS complex). Once the impulse gets thru the AV Node, it is conducted normally to the ventricles (which is why the slope of the vertical line for beat #11 that is within the ventricles is the same as the slope of the vertical lines within the ventricles for other sinus beats).
  • Beat #4 originates in the ventricles (which is why the small black circle is seen at the bottom of the V Tier). This is a ventricular escape beat (E in the Figure) — in which conduction begins in the ventricles, and then moves back toward the AV Node. Ventricular beats often penetrate at least partially through the AV Node. Technically, we do not know how far within the AV Node that they penetrate …. Note that at almost the same instant in time — a sinus impulse also began at the top of the A Tier. Although this sinus P wave is not seen in the long lead V6 rhythm strip — this sinus P wave IS seen just before the widened QRS complex of beat #4 in leads II and V1. The laddergram explains WHY this sinus P wave does not conduct past the AV Node (because it is prevented from doing so by retrograde conduction from the ventricular escape beat). The laddergram shows the reason for the 1.6 second delay before escape beat #4 (blocked PAC #3 necessitated a slight pause that was needed for the SA Node to recover before it could fire again).
  • In contrast — Beat #8 is a PVC (V in the Figure). As opposed to beat #4 (which was a late = “escape” ventricular beat) — beat #8 occurs early!. Note that a dotted line is use to convey conduction from the on-time sinus impulse — since the PVC hides the sinus P wave. Technically — We don’t actually see this sinus P wave on the ECG (that we presume occurs simultaneously with PVC beat #8). But because the following sinus P wave (before beat #9) is right on time (ie, it is perfectly “compensatory”) — we are virtually certain that a sinus P wave DOES occur simultaneously with PVC beat #8 (as is schematically shown on the laddergram).
  • WHAT ABOUT THE REST OF THE ECG? Unfortunately — No history is given … The rhythm is sinus, with 2 PACs, a PVC and a ventricular escape beat. It looks like there are small q waves in multiple leads (I,II,aVL,aVF,V4,V5,V6). It is hard to be certain if the QRS in lead III manifests a tiny initial r wave vs a wide Q wave. Regardless — there is notching on the downslope of the QRS in lead III, which in association with small q waves in leads II and aVF suggests that there may have been prior inferior infarction. The axis is normal (about 0 degrees). There is no chamber enlargement. Transition may be slightly delayed (occurs between V4-to-V5) and S waves persist to lead V6. The most remarkable finding are peaked T waves in V1,2,3 that occur in association with diffuse ST segment flattening. Hyperkalemia is less likely, since these peaked T waves are so localized. Instead, the history is critical — because these ST-T wave changes might indicate significant coronary disease, and possibly an acute event.
P.S. We offer the following LADDERGRAM Review materials:
  • Click on the Link to our ECG Video #9 for review of a case of AV Block with overview on Applying the Basics of Laddergrams. For the specific part on using Laddergrams — Fast forward to 9:10 in this Video.
  • Click on the Link for a Step-by-Step discussion from our ECG Blog #69 on How to Draw a Laddergram

Ken Grauer, MD  www.kg-ekgpress.com   [email protected] 

All our content is FREE & COPYRIGHT FREE for non-commercial use

Please be courteous and leave any watermark or author attribution on content you reproduce.