
Submitted by Dawn on Sun, 07/30/2023 - 17:01
The Patient: This ECG is from a 63-year-old man who complained of epigastric pain for three hours. The pain was sudden in onset, burning in nature, and accompanied by nausea and palpitations. The patient is a heavy smoker, diabetic and hypertensive with a long history of non-compliance to his medications.
He was given crushed aspirin, loaded with clopidogrel and heparin, given high-intensity statins, and rushed to the cath lab.
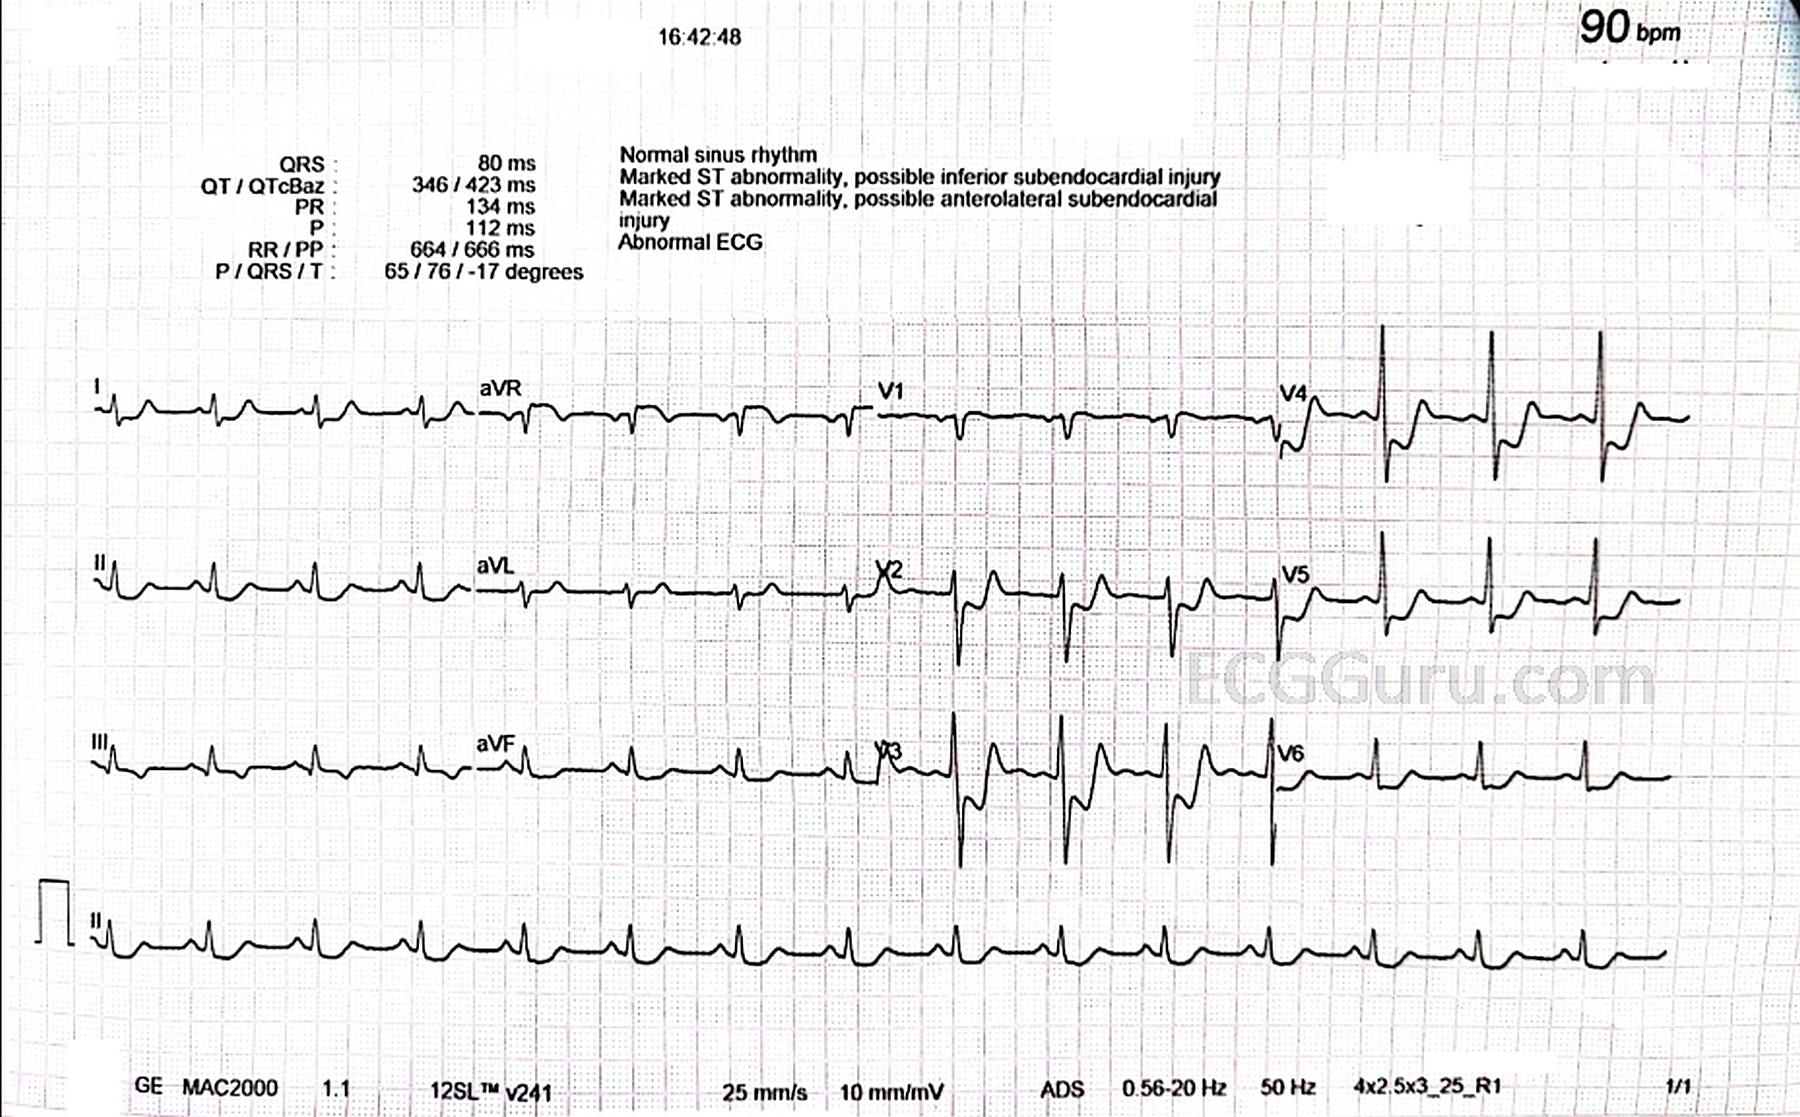
The ECG: The rhythm is normal sinus, a bit fast at 90 bpm. The intervals, frontal plane axis, and R wave progression are normal. This ECG shows a very dreaded pattern: ST segment elevation in aVR and V1 with widespread ST depression, seen here in all other leads. This is an ECG sign of GLOBAL ISCHEMIA. There are several possible causes, all bad. The most common causes of this pattern are:
· Severe triple vessel disease, with significantly decreased flow in the left anterior descending, right, and circumflex arteries.
· Significant narrowing and decreased blood flow in the left main coronary artery.
· Severe shock state, affecting perfusion in the entire body.
The Outcome: The patient’s results in the cath lab include:
LMCA: 80-85% occlusion
LAD: 90-95% occlusion
RCA: 75-80% occlusion
The first and second diagonal branches of the LAD: 60-65% occlusion
There was near global hypokinesia, probably due to stunning of the cardiac muscle.
His ejection fraction (EF): 25-30% (Normal is 60%).
A good lesson here is that not everyone experiences “crushing substernal chest pain, radiating to the left arm and jaw”. The presentation and patient history are very important, and in this case very indicative of cardiac disease.
Thank you to Dr. Mohammad Al-Shatnawi for providing this interesting case.
Related Terms:
Rate this content:
All our content is FREE & COPYRIGHT FREE for non-commercial use
Please be courteous and leave any watermark or author attribution on content you reproduce.
Comments
Not Quite “Pure” Subendocardial Ischemia …
Dawn has reviewed the basic ECG findings in today’s case — including the
presentation of epigastric pain (not chest pain) of 3 hours duration in this 63-year old
man with risk factors and a long history of “non-compliance” to medical treatment. As
per Dawn — there is diffuse ST depression with ST elevation in lead aVR greater than
in lead V1 — which is an ECG pattern consistent with DSI (Diffuse Subendocardial
Ischemia). Cath results in today’s case confirm that this patient had severe, diffuse
coronary disease as the cause.
I’ll add a few points to Dawn’s excellent discussion:
POINT #1: It’s important to remember that DSI may be caused by entities other than
severe coronary disease (with or without cardiogenic shock). Examples of other entities
that may cause an ECG pattern of DSI include sustained tachyarrhythmias (SVTs or
VTs) — profound hypotension — GI bleeding — anemia — and others (Please check
out ECG Blog #250 for more on this pattern of DSI — https://tinyurl.com/KG-Blog-250 ).
POINT #2: With a “pure” ECG picture of DSI from severe coronary disease — the
patient does not have acute coronary occlusion. Instead — they simply have severe
coronary disease, but with patent vessels. This point is commonly misunderstood. Also
poorly appreciated — is that the “numbers” for the degree of coronary narrowing do
NOT always tell the whole story — as during the course of acute coronary occlusion,
the “culprit” vessel may sometimes occlude — then spontaneously open — then
reocclude, going through this process sometimes multiple times until there is finally a
stabilization of the event. We have NO idea from the limited history here if this might be
a possibility (ie, We just don’t know if any of the coronary narrowings mentioned here
were at some recent time completely occluded … ).
POINT #3: Although true that there is diffuse ST depression in 9/12 leads (with ST
elevation in lead aVR>V1) — this ST depression is MAXIMAL between leads V2-thru-
V4, in which there are biphasic T waves with terminal positivity. The “shape” of the ST
depression in these leads suggests a positive “Mirror Test” — with this localization (ie, of
clearly maximal ST depression between leads V2-to-V4) — suggests that in addition to
diffuse coronary disease — there may also be acute posterior MI.
POINT #4: Isn’t it “strange” — that lead III shows a flat ST segment and a different
“shape” of T wave inversion than is seen in the other inferior leads. This is because
today’s ECG has elements suggestive of Aslanger’s Pattern, in which the patient has
severe, diffuse coronary disease in association with acute/recent inferior infarction
(Please check out ECG Blog #322 https://tinyurl.com/KG-Blog-322 — for more on
Aslanger’s Pattern).
Alas, not all patients read the textbook — and especially in today’s patient known for his
poor compliance with medical treatment — it is anyone’s guess as to what happened
when in terms of prior, recent and/or acute cardiac events. What we DO know — is
given the history of severe chest pain and this ECG — that immediate cardiac cath was
essential!
Ken Grauer, MD www.kg-ekgpress.com [email protected]