Dawn's picture

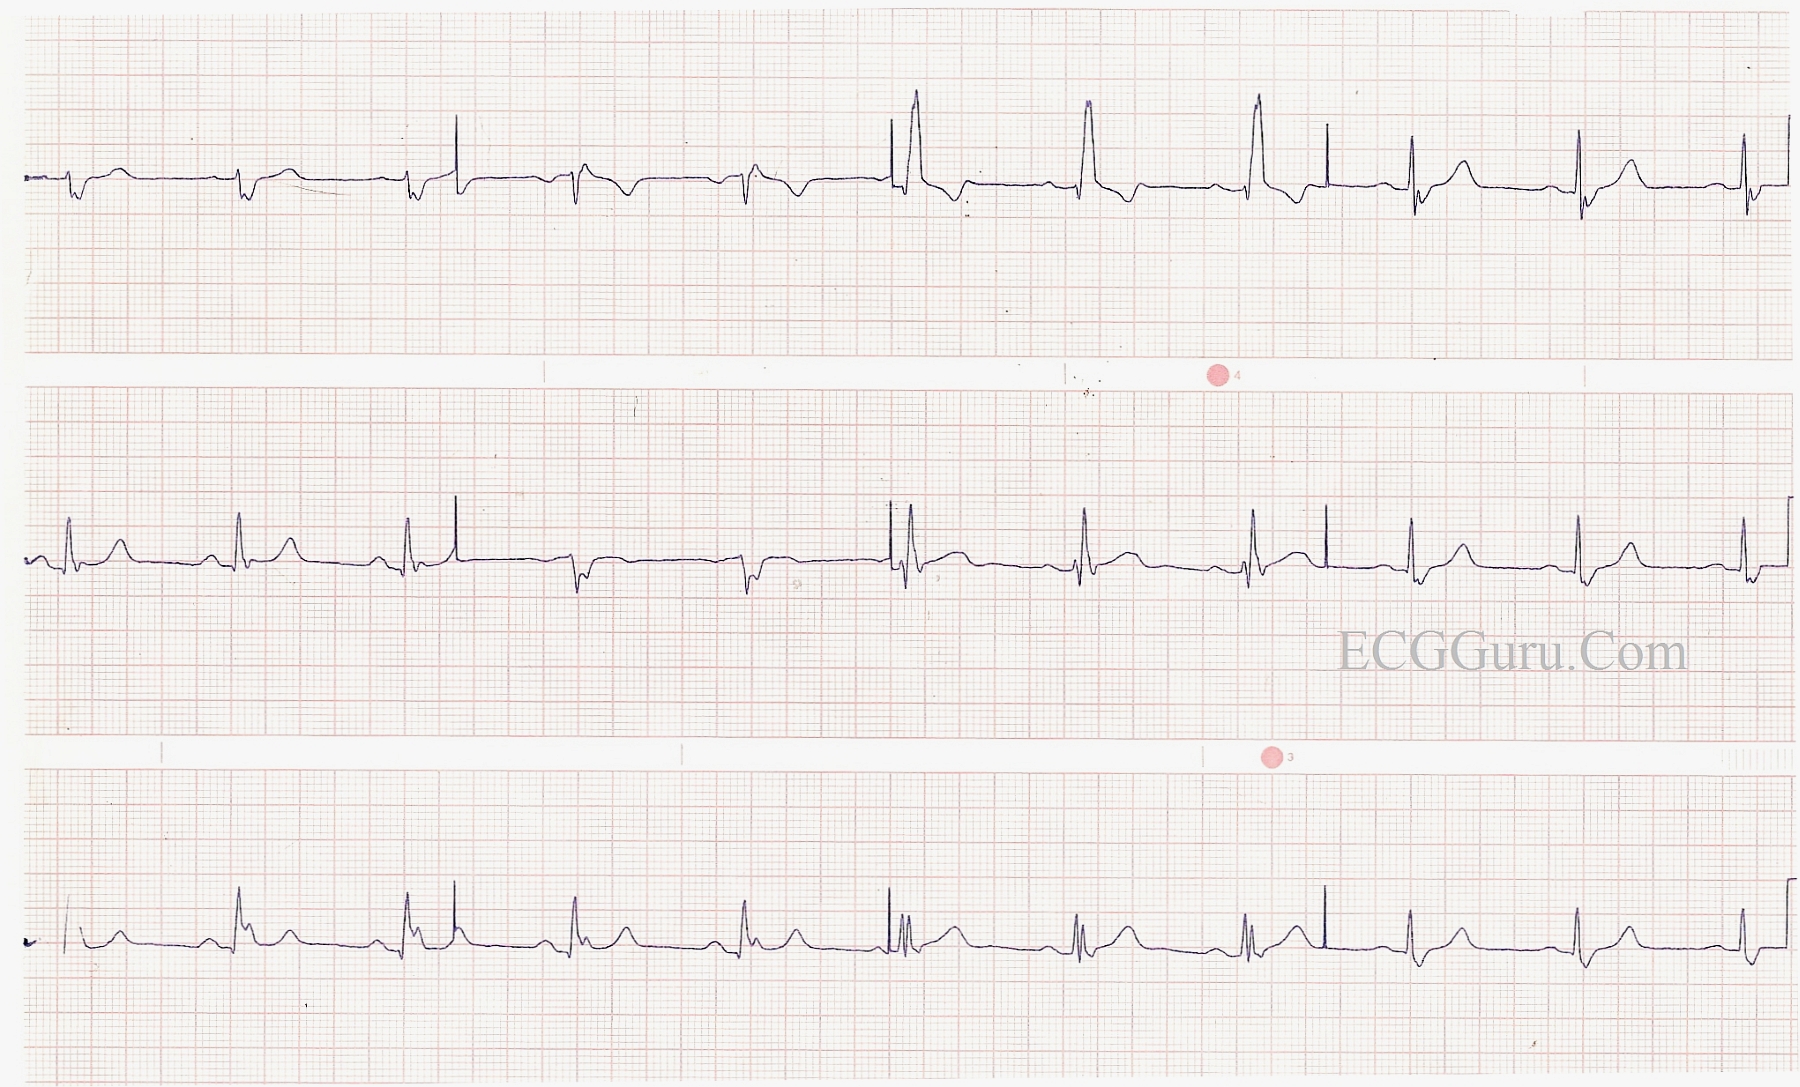
This is a good clear example of right bundle branch block with left posterior fascicular block.  The RBBB is diagnosed by the following criteria:  wide QRS (.12 sec), supraventricular rhythm (NSR), an rsR' pattern in V1, and wide little s waves in I and V6.  The LPFB is inferred by the right axis deviation (Lead III QRS is a bit taller than Lead II and Leads I and aVL are negative), and the fact that there is no other obvious cause for right axis shift noted in this patient.  This constitutes a BIFASCICULAR BLOCK.  The ventricles are being depolarized by way of the anterior fascicle.  In addition, there are slight ST elevations in many leads, with an upward coving in the anterior-septal leads (V1, V2, V3).  Depending upon the patient's history and presentation, this could represent a recent M.I. or pending issues. The borderline first-degree AV block may be of concern in this patient, since first-degree AVB is associated with progression of bifascicular block to complete heart block.  Reference:  Ann Card Anaest, 2010 Jan-Apr;13(1):7-15. doi: 10.4103/0971-9784.58828


Rate this content: 
Average: 4 (3 votes)

Comments

ekgpress@mac.com's picture

I will make a number of observations on this interesting example of RBBB posted by Dawn.

  • As per Dawn - the diagnosis of definite complete RBBB is assured by the presence of QRS widening with typical RBBB morphology (rsR' in lead V1; wide terminal S waves in leads I and V6).
  • ST-T waves ARE as expected in the 3 "KEY" leads. These leads are leads I, V1 and V6 - and normally (ie, with "pure" RBBB or LBBB) - the ST-T wave should be oppositely directed to the last QRS deflection. Thus one expects the T waves to be upright in leads I and V6 (since the last QRS deflection in these leads is the negative S wave) - and one expects the ST-T wave to be down in lead V1 (since the last QRS deflection in V1 is the tall, upright R wave). Note - this does NOT rule out ischemia/infarction, for which we need to: i) look at the other 9 leads; and ii) Realize reduced sensitivity of the ECG for assessing this in the setting of BBB. But - IF you do see "primary" ST-T wave changes in one or more of the 3 KEY leads (ie, if the ST-T wave is not opposite the direction of the last QRS deflection in these leads) - it is a tip-off that ischemia/infarction may be operative, and that you need to look MUCH closer into associated factors.
  • There is LPHB (Left Posterior HemiBlock) present on this tracing. Realize that there are 2 types of hemiblock = Anterior and Posterior. (Beyond-the-Core - there is a third type of hemiblock referred to by some, which is septal - but this is far less common, much more difficult to diagnose, and not nearly as helpful as "simplifying life" with the concept of 2 types of hemiblock). Of the 2 - LAHB is far more common (!!!) than LPHB - because of a dual blood supply to the posterior hemifascicle and it being a much thicker fascicle anatomically (thereby being much more difficult to interrupt). This means that IF you in fact ever DO see true LPHB - that it is likely to reflect far greater underlying disease/injury/scarring than the much more common LAHB.
  • There is GREAT variation among cardiologists as to what "constitutes" true LPHB. Even the experts do not always agree ..... The definition I favor goes by rightward axis of the INITIAL PART of the QRS complex. Thus you have exactly what is seen here - namely a VERY STEEP initial straight downward deflection in lead I (rS complex) - with the opposite QRS morphology (qR) in leads II and III. This is undoubtedly due to bifascicular block (RBBB/LPHB).
  • I do not see 1st degree AV block. I do not even see "borderline" 1st degree. My bias is to DELETE the term "borderline" 1st degree from one's ECG vocabulary. Studies have documented that the isolated occurrence of 1st degree AV block (even marked 1st degree) in the absence of underlying heart disease is almost always benign. Therefore - IF you have "borderline" 1st degree - what you are saying, is that you "almost" have a finding - that even if it was present - would mean virtually nothing ... Therefore - Why say it? Instead- my bias is to say that the PR interval is either normal or long. Realize there is a Bell-shaped curve defining "long" - and that many individuals have a normal PR interval that is 0.21 second. Therefore - for true "1st degree" AV block to be present - in my opinion, the PR should be at least 0.22 second in duration - and it does not approach that in this tracing. 
  • Finally - I agree that there is a hint of some ST elevation in a number of leads - most notably V1,V2. That said - I do not get a "sense" that this elevation is acute. Would be different IF the history was that of new-onset chest pain! In that circumstance - depending on clinical status, prior tracings, serial ECGs, physical exam findings, etc - this tracing could reflect an acute event. However - my sense from this isolated "snapshot" of the ECG presented here - is that it it less likely to reflect something acutely evolving. That said - CLINICAL CORRELATION is essential to know better.
  • LAST OBSERVATION POINT: Were you as "struck" as I was by the notching in the middle and end portion of the QRS complex in many of the leads on this tracing? Although at first I contemplated the possibility of retrograde conduction - given the clear normal sinus P waves - I think this instead is reflection of the underlying extensive conduction system block described above. Interesting notching though!
 --------------------------------
Additional Information on BBB:

Ken Grauer, MD  www.kg-ekgpress.com   [email protected] 

All our content is FREE & COPYRIGHT FREE for non-commercial use

Please be courteous and leave any watermark or author attribution on content you reproduce.