
Submitted by Dawn on Thu, 05/12/2016 - 13:03
Occasionally, we like to feature a normal ECG. It is important to start with the characteristics of the normal ECG when learning to recognize “abnormal”. Of course, there are many variations in ECGs considered to be normal. Once a student recognizes the features of the normal ECG, it becomes possible to recognize “abnormal” and then learn the clinical ramifications of the abnormalities.
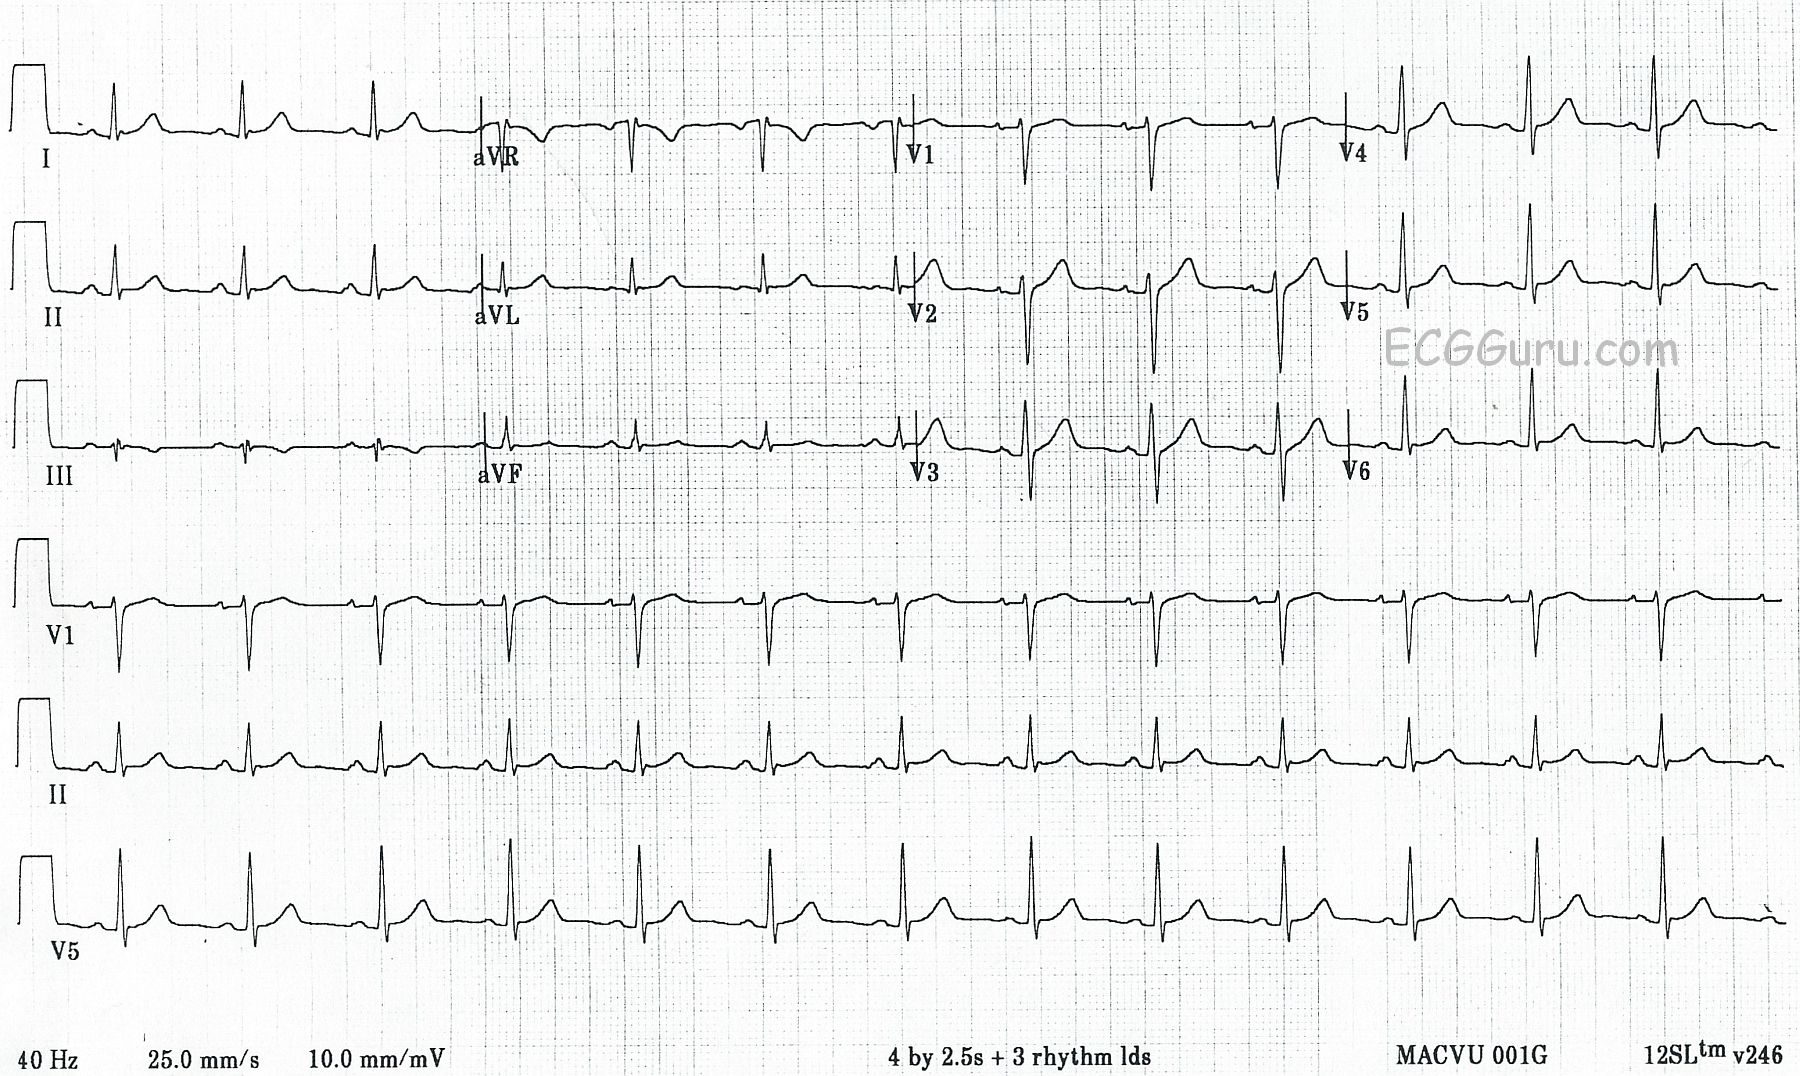
This strip includes a 12-lead ECG in standard format, as well as three rhythm strips in Leads V1, II, and V5. All six channels are run simultaneously, so it is easy to compare one heartbeat in multiple leads.
NORMAL FEATURES
What are the features of this ECG that make it “normal”? It is a combination of features the ECG has, and features it does NOT have. Normal findings include:
* Normal sinus rhythm. The rhythm is regular, the rate is 80 bpm, and there is a P wave before every QRS complex. The P waves all look alike in each lead, and they are upright in the inferior leads (II, III, and aVF).
* The intervals are within normal limits. The PR interval is about .16 sec. (160 ms), the QRS complexes are narrow, and the QT interval is about 320 ms.
* The ST segments are not elevated or depressed. The T waves are upright, except in Leads III and aVR. Negative T waves are normal in these leads. The shape of the ST segments is concave upward, “smiling”.
* The frontal plane axis is within normal limits. It is slightly to the left of the center of normal, making Lead I taller than Lead II. But, when Lead II is positive, the axis is normal.
* R wave progression is correct in the precordial leads. The relative size of the R wave to the S wave in each lead is increasing as we progress from V1 to V6. Therefore, V1 is mostly negative, and V6 is mostly positive. The change occurs in regular increments as we move to the patient’s left. This is indicative of correct lead placement as well as normal direction of depolarization.
ABNORMAL FEATURES THAT ARE NOT PRESENT
* There are no ST elevations or depressions, and no pathological Q waves.
* There is no QRS widening. There is no PRI or QT prolongation.
* There is no dysrhythmia.
* There are no signs of hypertrophy.
Remember, what constitutes “normal” has many variations. For example, a normal rate in an infant would be considered tachycardia in an adult.
Related Terms:
Rate this content:
All our content is FREE & COPYRIGHT FREE for non-commercial use
Please be courteous and leave any watermark or author attribution on content you reproduce.
Comments
How to Use a Normal ECG for Teaching
I agree with Dawn about how effective it is to periodically teach ECG interpretation by showing normal tracings. This is true regardless of the level of the learner. No history is given for the tracing presented here. I will often introduce a tracing like this saying, “Imagine this patient was a middle-aged adult with chest pain. How would you interpret the tracing?” Giving a history such as this adds to the challenge of recognizing when an ECG is remarkable or not. For example, I may give my group an ECG to interpret — and then ask them how they would interpret the identical tracing if instead of “intermittent atypical chest discomfort”, the patient had “new-onset worrisome chest pain”; or pleuritic chest pain following recent upper respiratory infection (suggesting pericarditis by history); or perhaps no chest pain at all. I might also vary the scenario by changing the age of our imagined patient, or by using an office rather than emergency setting. There simply is no better way to convey the importance of clinical correlation for interpreting the tracing at hand. I like to break up my group into pairs — giving them a few minutes to look at a normal tracing (without telling them the ECG is normal) — and ask them what they would do clinically? Are they certain the tracing is unremarkable?
In this particular case — I see no important ECG changes. That said, one important message is for the group recognize that there will not always be abnormal ECG findings at the time the initial tracing is obtained. If the history is worrisome — then a single “unremarkable ECG” does not rule out the possibility of an acute cardiac event. Close clinical follow-up; serial tracings; Echo at the bedside during symptoms; and possibly serum troponin may all be needed in order to arrive at greater certainty about whether or not an acute cardiac process is evolving — with the caveat that determination of whether to send the patient home must be accomplished without additional testing if the patient presents to the office ...
Regarding this case — there are a number of additional teaching points that may be made. Many of these instructive observations are typically overlooked by even skilled interpreters due to focus on finding more obvious abnormalities. To show how to make even mundane tracings “teachable material” — I’ll suggest the following potential discussion points.
Ask the group if there is ST segment elevation in any leads? As simple as this questions seems — I found myself staring at the various leads on this tracing for minutes going back-and-forth as to whether there is or is not some ST elevation. Part of this discrepancy relates to the issue of whether to use the PR segment or the TP segment as the “baseline” for judging ST segment deviation. Both have been suggested. Both have their pros and cons. Several of the leads in this particular tracing manifest slight PR segment depression (ie, leads I,II; V2,V3,V4,V5,V6). Although commonly cited as a supportive finding for acute pericarditis — PR depression may also be seen in association with acute ischemia or even with normal tracings. Dependence on the PR segment baseline when there is PR depression may therefore falsely suggest ST segment elevation. The horizontal RED lines I’ve drawn in leads II, V2 and V3 use the PR segment as the baseline (See attached image below). Several leads on this tracing suggest there may be slight ST segment elevation. That said — the amount of any ST elevation is minimal — the shape of ST segments in virtually all leads except III and aVR is concave-up (ie, “smiley”-configuration) — there is no localization — and, there are no reciprocal changes, such that this tracing looks benign.
The ST segment is coved and the T wave inverted in lead III (within the RED rectangle). Does this reflect ischemia? If the other 2 inferior leads (leads II and aVF) showed similar ST-T wave changes — then this appearance would be concerning. However, the abnormality here is isolated to a single lead. T wave inversion may normally be seen in lead III and/or lead aVF as an isolated finding. Such T wave inversion is especially likely to be benign when the predominant deflection of the QRS complex in these leads is negative — as the T wave vector often follows fairly closely behind the predominant QRS vector. So although the T wave in lead aVF is relatively flat — the predominantly negative QRS complex in lead III, and the complete lack of ST-T wave abnormality in lead II strongly suggest in a patient without worrisome chest pain that the ST-T wave seen in lead III is benign. I mention “slight ST coving and shallow T wave inversion” in my descriptive analysis of this tracing (so that others know that I saw this finding) — but clinically, I state in my interpretation that this is unlikely to be of any significance.
Is the RED arrow in lead aVF pointing to a delta wave? Clearly, there is slight delay in the initial upstroke of the small-amplitude QRS complex in this lead. But the QRS complex is narrow, and nothing remotely resembling a delta wave is seen in any other lead. We often see slight delay in the initial upstroke of the QRS complex in one or two leads. When the QRS is clearly narrow, the PR interval is normal, and delta waves are not seen elsewhere — this is not an abnormal finding.
Is standardization of this tracing normal? Is paper speed and the amount of filtering appropriate? Why do we care? The answer is, that we don’t care when all settings are as they should be. But unless we realize what those settings are supposed to be — We are unlikely to recognize when they are off ...
Standardization of this tracing is normal = 10.0 mm/mV. This information is noted within the BLUE rectangle in the lower left of the ECG. We see the same information graphically illustrated by the normal standardization mark that is 2 large boxes ( = 10mm) tall (within the BLUE rectangle in the upper left of the tracing). It’s important to be aware of the standardization used — because on occasion half-standardization (ie, 5.0 mm/mV) may be used instead. In this case, QRS amplitude will actually be twice the amount seen on the tracing. It is easy to overlook LVH if one looks at a tracing without realizing that certain leads on the ECG were recorded at half-standardization.
The standard recording speed for 12-lead tracings in the United States = 25.0 mm/second. This information is shown just to the left of the BLUE rectangle at the bottom of this tracing. But this standard speed is not always used, and in other countries different recording speeds may be used (12.5 or 50 mm/second). If the clinician does not realize that the recording speed was 50 mm/second, you may wonder why the rate looks slow and the QRS wide (the QRS appears twice as wide and the rate half as fast when a recording speed of 50 rather than 25mm/second is used).
Finally — one should be aware of commonly used filter settings. Different settings are typically used for monitoring when emphasis is placed on rhythm determination vs diagnostics, for which the focus is on interpreting 12-lead waveforms. Greater filtering is generally used in monitor mode, with a common setting being between 0.5 Hz and 40 Hz. Doing so has the advantage of minimizing artifact and baseline wander that may affect rhythm interpretation. A broader passband (typically from 0.05 Hz to 150 Hz) is recommended for diagnostic mode, where more accurate ST segment analysis is essential. On this ECG, all we see is, “40 Hz” (at the bottom of the tracing, written to the left of the paper speed indication). This 40 Hz value is presumably the LOW-pass filter setting (ie, allowing signals with a frequency LESS than this to pass)— with no HIGH-pass filter limit seen … If the HIGH-pass filter setting (ie, allowing signals with a frequency GREATER than this to pass) was typical for monitoring (ie, 0.5 instead of 0.05 Hz) — this might contribute to ST-T wave distortion and/or false appearance of ST segment elevation, when in fact there is none. Other alterations in the fine points of Q wave, QRS complex and ST-T waveform appearance may be introduced by use of an overly narrow filter range. The generally recommended frequency setting for 12-lead diagnostic mode ECG interpretation in adults is 0.05 – 150 Hz. An even higher upper frequency limit may be used in infants or young children. If muscle artifact is severe, one may need to compromise with a narrower range setting of 0.05 – 100 Hz (or 0.05 – 40 Hz) — but the recommended range 0.05 – 150 Hz should be tried first. If compromise in filter settings is needed, then at least be aware that there may be less than optimal fidelity for ST segment analysis. This explains why single-lead rhythm strips should not be used for ST segment analysis. One may be alerted to possible/probable ST segment elevation based on changes seen on a rhythm strip — but when clinically important, this should always be verified on a 12-lead tracing.
NOTE: Keep in mind that Pacemaker spikes are a HIGH Frequency signal — so these may be filtered out if the LOW-pass setting is 40 Hz (and you might erroneously think the tracing showed QRS widening due to LBBB or a ventricular rhythm). If trying to determine IF pacer spikes are present — RESET filter settings to 0.05-150 Hz, and pacer spikes should now be seen at this higher LOW-pass filter setting! (CLICK HERE — for a great example of how filter settings may prevent detection of pacer spikes! ).
-------------------------------
P.S: Is lead III in this tracing really consistent with a "benign" ECG? Please see my ECG Blog #79 for more on this subject.
Ken Grauer, MD www.kg-ekgpress.com [email protected]