Dawn's picture

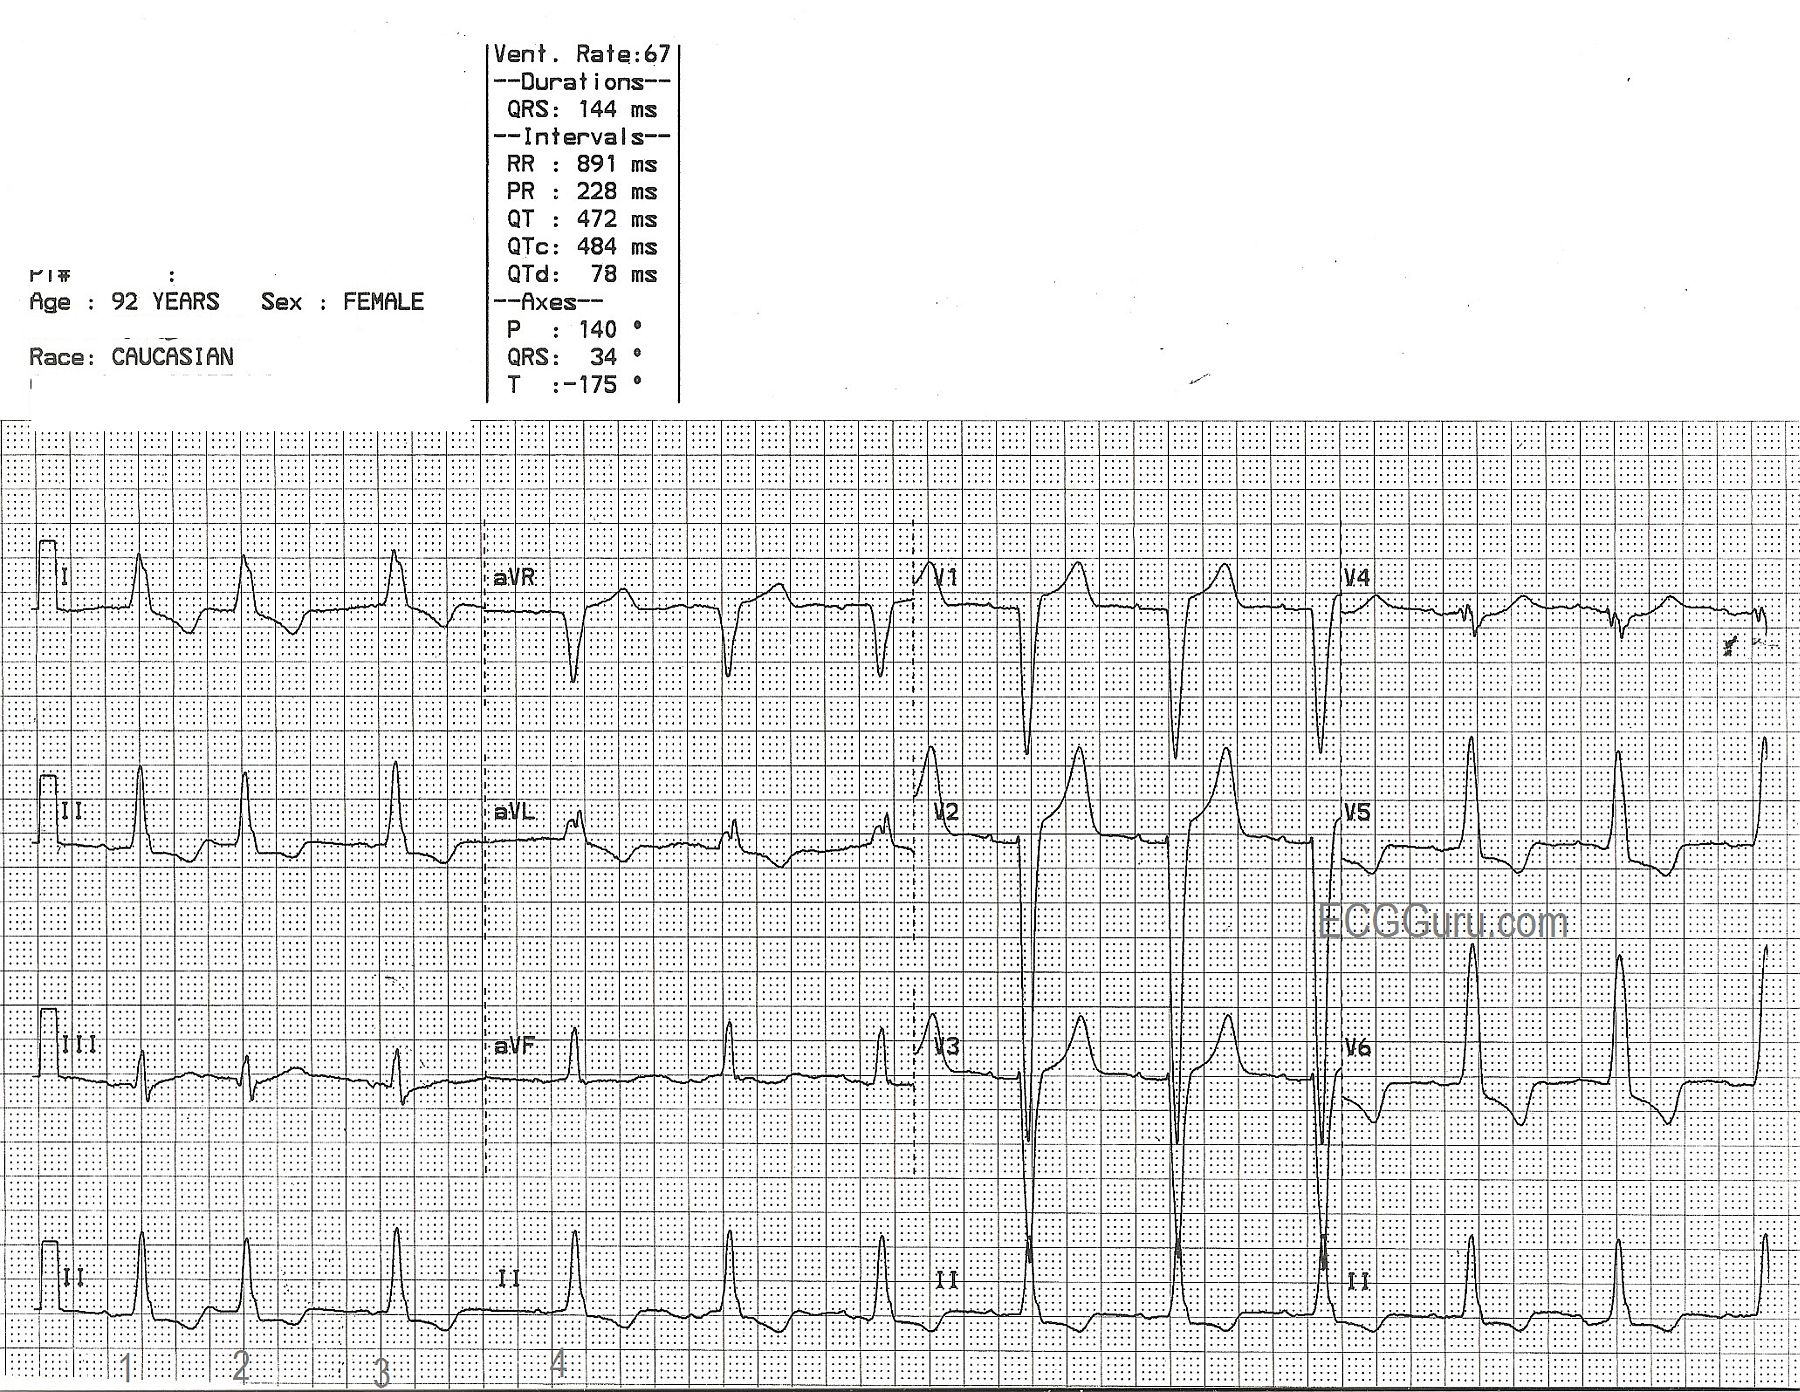
This ECG offers a good example of the left bundle branch block pattern.   * The QRS is wide at 144 ms.  * There is a supraventricular rhythm - in this case, normal sinus rhythm with beat number two a PAC, and a slightly prolonged PR interval.  * The QRS is negative in V1 and positive in V6 and also Lead I.  This satisfies the ECG criteria for left bundle branch block.

The main lesson this tracing offers for beginner or refresher students is the value of multi-lead assessment. Using only one or two leads, you may miss important information needed to correctly interpret the ECG.   In order to meet the LBBB criteria, we must show that there exists a supraventricular rhythm (not ventricular). One easy way to prove the rhythm is supraventricular is the presence of P waves.  In this ECG, P waves are very small, and are invisible in some leads, such as Lead I, aVL, Lead III, and aVF.  P waves can be seen well in Lead II and in the chest leads.  Some helpful hints, if viewing on a computer, enlarge the image to better see the P waves.  Look at the ECG machine's interpretation.  If a numerical PR interval is given, and a P wave axis, then the computer is finding P waves.   If you don't see them in one lead, try others.

For your more advanced students, ST elevation is common in wide-QRS rhythms, occuring in leads that have a negative QRS complex.  Conversely, ST depression will be seen in leads with wide, upright QRS complexes.  This makes the ECG with LBBB very confusing to read.  Evaluation of the ST segments should be deferred to experts.  Most EMS field protocols allow for a STEMI Alert to be called in LBBB only if the LBBB is known to be new-onset and the patient has obvious cardiac symptoms.  You can find many more examples of LBBB on this site, even LBBB with acute MI.   

Rate this content: 
Average: 5 (2 votes)

Comments

ekgpress@mac.com's picture

     The 12-lead ECG in this case shows sinus rhythm, a PAC, and complete LBBB (Left Bundle Branch Block). 
 
Our favorite "set-up" for leads is recording on a simultaneous 3-channel recorder, with a long lead II rhythm strip at the bottom. This allows convenient comparison of one beat to the next. For example - IF the only look we had at lead II were the 3 beats in this lead that occur on the 12-lead tracing - we would in no way be certain of the rhytnm. But we have 12 beats from lead II in the simultaneously run rhythm strip at the bottom of the page. This allows us to confirm that the tiny deflection preceding each QRS complex is in fact consistent for all beats except beat #2. Beat #2 is early - manifests a similar QRS morphology - and probably has a P wave buried within the T wave of beat #1. Beat #2 is therefore a PAC. Lest there be ANY doubt that the small amplitude deflection in lead II is a sinus P wave - we confirm P wave presence by simultaneously run leads V1,V2,V3 which show an atrial deflection perfectly timed with the tiny deflection in lead II.
 
  • Use of multiple leads is often invaluable confirming QRS duration. For example - the QRS in lead aVF here doesn't look overly wide - yet vertical time lines dropped down from lead aVL confirm the marked QRS widening.
  • Otherwise - this tracing illustrates the difficulty in diagnosing ischemia/infarction in the presence of LBBB. The poor R wave deflection does not indicate anterior infarction - but rather the effect of the LBBB. T waves are peaked in V1,V2,V3 and there is some J-point ST elevation in these leads - but given the LBBB, nothing definitive can be said here about the possibility of ischemia/infarction.
  • There is notching of the QRS in lead V4. This QRS fragmentation may sometimes indicate infarction occurred at some point (Cabrera's sign) - though it is far less specific when the only lead showing such notching is a transition lead from a deep-amplitude S wave to a tall lateral precordial QRS complex.
  • There does seem to be some J-point ST depression in several leads - but again, this looks nonspecific
  • Finally - the very deep S waves in one or more anterior leads (clearly greater than 30mm) strongly suggests LVH when seen in the presence of LBBB.
So we interpret this tracings as showning "Sinus rhythm; a PAC; LBBB - and nonspecific ST-T wave abnormalities that are probably not acute. Suggest clinical correlation."

Ken Grauer, MD  www.kg-ekgpress.com   [email protected] 

All our content is FREE & COPYRIGHT FREE for non-commercial use

Please be courteous and leave any watermark or author attribution on content you reproduce.