
Submitted by Dawn on Mon, 01/09/2012 - 22:48
During our summer break, we are reprising a few of the best ECGs from our archives, to give you a chance to comment or to ask questions.
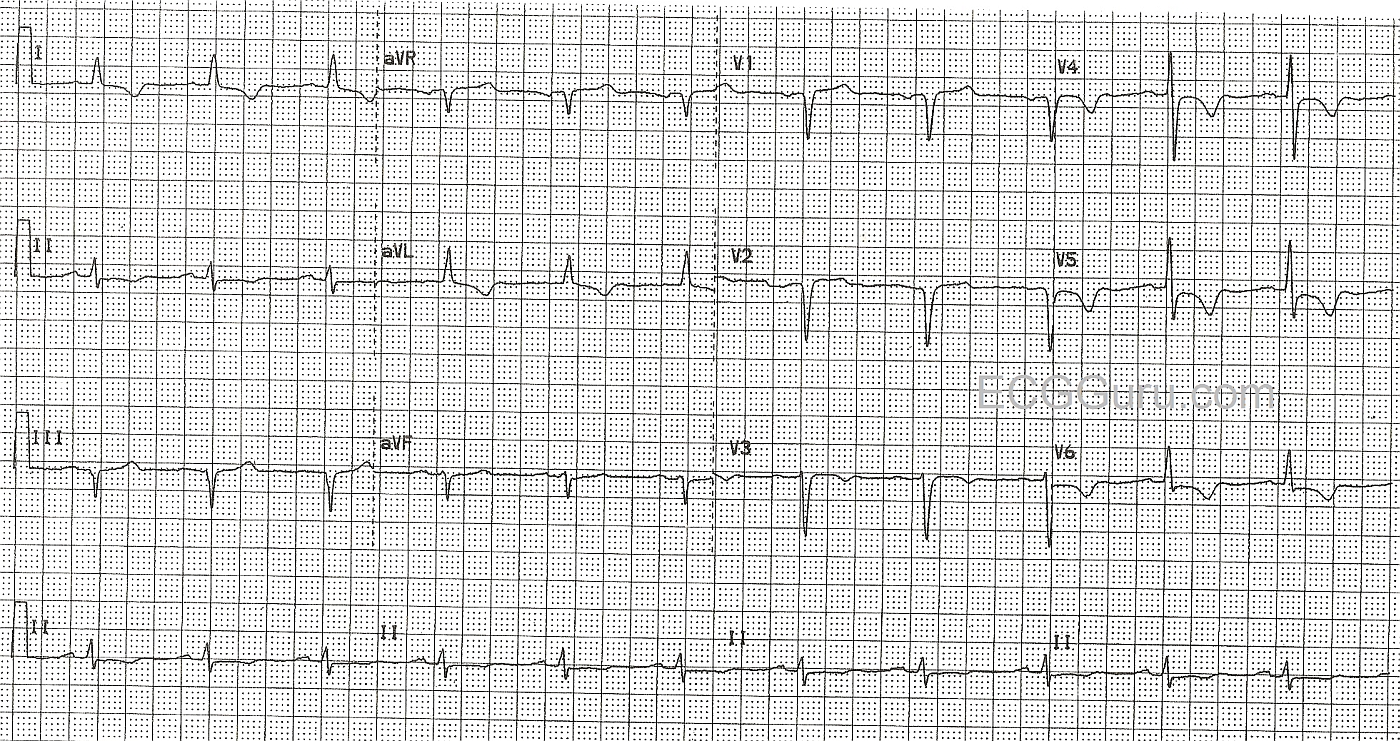
This ECG was taken from a 52 year old man who was complaining of chest pain, with a history of severe multi-vessel disease. He has a history of M.I. and states he has five coronary stents.
His pain was partially relieved by Ntg., and he was given aspirin in the field, and then IV Ntg., Integrelin, and morphine before being sent to the cath lab. This ECG shows T wave inversions with coved upward ST segments, but no ST elevation in the lateral leads: I and aVL, and the anterior-lateral leads, V3 through V6. This represents the territory covered by the left coronary artery, and points to a lesion in the proximal portion of the artery. Also in this ECG are pathological Q waves in right side leads, III, V1 and V2.
In the cath lab, he was discovered to have a ruptured plaque in the proximal LAD, with some blood getting through a very narrow channel. He was referred for coronary artery bypass surgery the next day.
Related Terms:
Rate this content:
All our content is FREE & COPYRIGHT FREE for non-commercial use
Please be courteous and leave any watermark or author attribution on content you reproduce.
Comments
Ischemia on ECG: Systematic Approach to Interpretation
This case provides an excellent example of how to correlate Systematic Interpretation of an ECG with the clinical scenario. My approach to this case begins with Descriptive Analysis, in which I sequentially assess Rate — Rhythm — Intervals — Axis — Chamber Enlargement — and, Q-R-S-T Changes. Regular sinus rhythm is present at a rate of about 70/minute. All intervals (PR, QRS duration, QT) are normal. The axis is leftward (since net QRS deflection in lead aVF is negative) — but not leftward enough to qualify for LAHB (left anterior hemiblock). The axis is approximately -15 degrees. There is no chamber enlargement. This leaves us with assessment of Q-R-S-T Changes.
Q-R-S-T Changes: QS complexes are present in lead III, and in leads V1,V2. A small but-definitely-present initial positive deflection (r wave) is seen in lead V3. Transition is slightly delayed (the R wave only becomes taller than the S wave is deep between V4-to-V5). ST segments are coved ("frowny"-shape) in leads V4,V5,V6. There appears to be 1-2 mm of J-point ST depression in these leads, followed by symmetric T wave inversion. T wave inversion actually begins in lead V3. It is also seen in the high lateral limb leads (leads I and aVL). The ST segment is depressed in lead II. There is no ST segment elevation.
Clinical Impression: The patient in this case is a 52-year old man with a history of severe coronary disease, prior infarction, and multiple previous stent placements. He presents with new chest pain. Clearly, the J-point ST segment depression, ST segment coving, and symmetric T wave inversion in multiple leads may indicate ischemia. This ischemia could be new. That said, we have no idea if the ECG findings on this tracing are new or longstanding — since we have not been provided with any prior (baseline) ECGs on this patient for comparison. Given his medical history — even if the above ECG findings were not new, prompt evaluation (ie, with cardiac catheterization) might still be in order. If these ECG findings are new — then the indication for cardiac catheterization is that much stronger.
Selected Comments: The QS complexes seen in this tracing are not diagnostic of prior infarction. Even large Q waves (or QS complexes) in lead III and/or lead aVF may sometimes be seen in patients who have not had prior infarction. In the absence of any Q wave in the other inferior lead (lead II) — we merely report the QS complex in lead III as a descriptive finding of uncertain significance. If no such QS complex was present in lead III prior to this patient's myocardial infarction — then recognition of a new QS complex in lead III after his infarction may serve as a marker of previous necrosis, but not otherwise.
Similarly, the presence of QS complexes in leads V1 and V2 is not diagnostic of prior septal or anteroseptal infarction. That's because a definite small positive deflection (r wave) IS present in lead V3. Statistically, the finding of a QS complex in leads V1,V2 but not V3 is far more likely to be due to body habitus or lead misplacement, than it is to be a marker of prior infarction. Only when no r wave at all is seen in leads V1, V2 and V3 in a patient without LVH or QRS widening due to bundle branch block — does it become more likely than not that the patient has had prior anterior infarction. Therefore, we simply note the presence of a QS complex in leads V1 and V2 in this case — and, leave it to clinical correlation to determine if this is or is not likely to be a significant finding.
Finally, regarding ischemia — we note a series of suggestive ECG findings. Not only is there symmetric T wave inversion in anterolateral leads — but the J-point is clearly depressed below the baseline in leads V4,V5,V6; as well as in lead II. In addition, the ST segment is coved ("frowny"-configuration) in lateral chest leads. In view of the clinical history in this case — it is no surprise that cardiac catheterization showed acute disease.
----------------------------------------------------------
NOTE: For quick review of the Systematic Approach to ECG Interpretation discussed above — Please Check Out my ECG Blog #93 —
Ken Grauer, MD www.kg-ekgpress.com [email protected]