
Submitted by Dawn on Fri, 07/17/2020 - 10:44
The Patient: 44-year-old man with chest pain. Symptoms started over 24 hours ago. The EMS crew recognized an acute M.I. on the ECG and transferred him immediately to a cardiac hospital. They started two I.V.s and gave aspirin enroute.
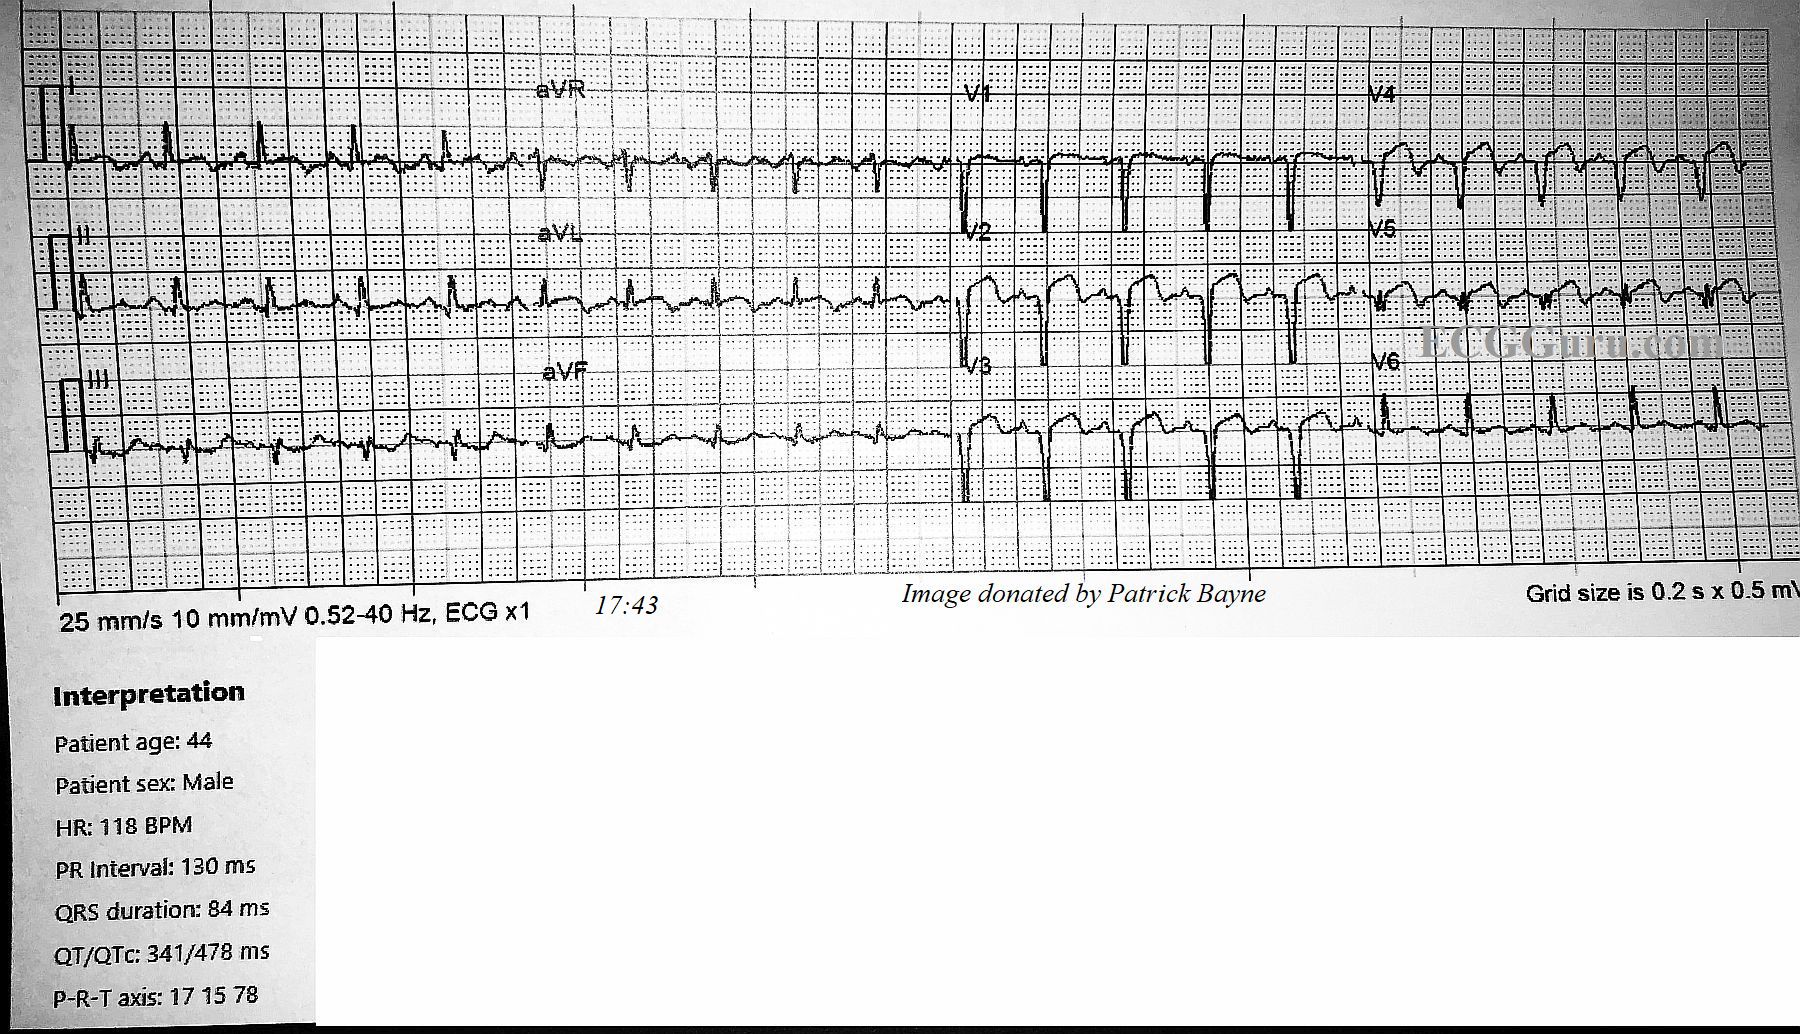
ECG No. 1 @17:43: The rhythm is sinus tachycardia at 118 bpm. The PR interval is within normal limits at 130 ms, and the QRS is narrow at 84 ms. The QTCc is 478 ms by the machine’s measurement, but we measured the QT at 303 ms and QTc as 376-419 ms via various methods, which are within normal limits. The QRS frontal plane axis is at 15 degrees, within normal limits.
The ST segments are elevated and mostly straight in Leads V1 through V5, I and aVL. There is mild ST depression in III and aVF. Very concerning are the pathological Q waves in V1 through V5, indicating loss (death) of myocardial tissue in the anterior wall.
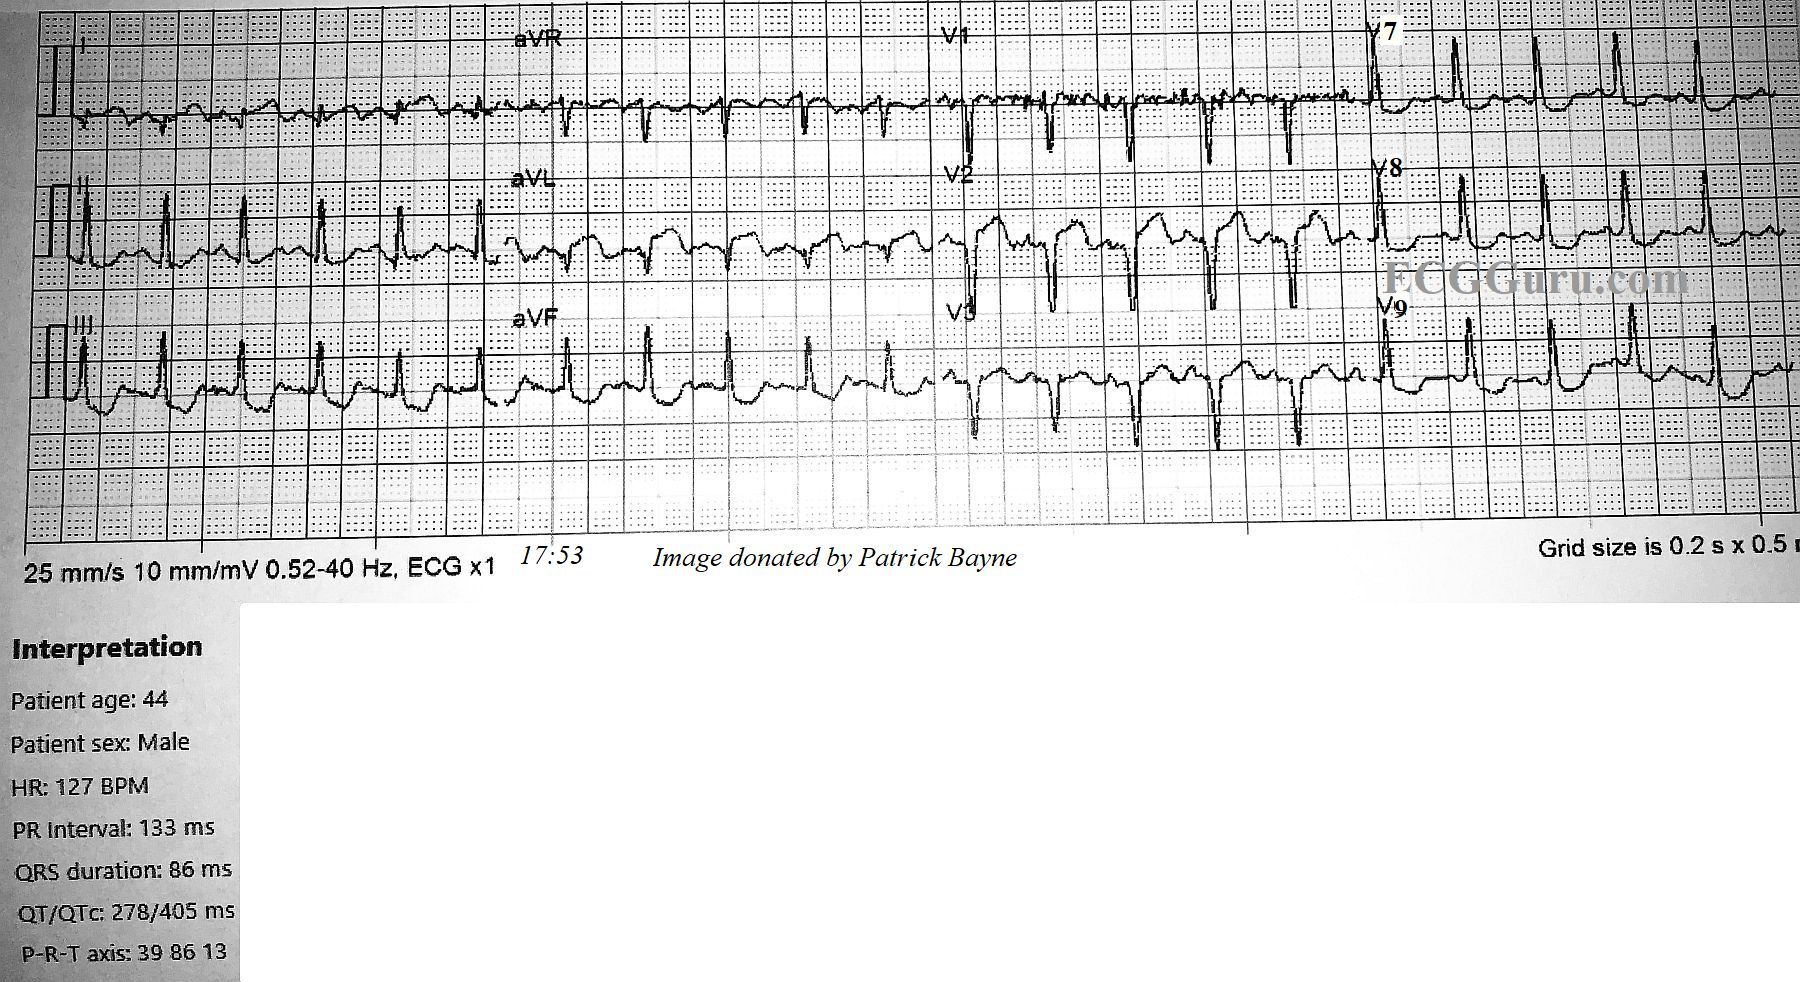
ECG No. 2 @ 17:53: The second ECG was performed about 10 minutes later, and V4, V5, and V6 were replaced by V7, V8, and V9. Reciprocal ST depression is observed in those additional leads. The heart rate is now 128 bpm. It is notable that pathological Q waves have now appeared in Leads I and aVL. There has been no change in lead placement. The onset of necrosis in the high lateral wall has shifted the frontal plane axis toward the right extreme of normal, at 86 degrees, and now II, III, and aVF have prominent R waves. Another cause for right axis shift in anterior wall M.I. to consider would be posterior hemiblock. However, that is a diagnosis of exclusion, and the new Q waves explain the axis shift. It is interesting that the onset of pathological Q waves was captured in these serial ECGs.
Follow Up: The patient was found to have troponin levels over 40, and an occlusion of the left anterior descending artery. In addition, he had severe multi-vessel disease. Angioplasty was done on the LAD, with stent, and he was scheduled for 4-vessel coronary artery bypass surgery the following day. He was maintained on a balloon pump in the CVICU awaiting surgery.
Rate this content:
All our content is FREE & COPYRIGHT FREE for non-commercial use
Please be courteous and leave any watermark or author attribution on content you reproduce.
Comments
Extensive Antero-Lateral STEMI over the Past Day (or so ...)
It is always insightful to assess serial tracings when the clinical presentation and cath findings are known. For clarity — I’ve put these 2 tracings (done 10 minutes apart) together into a single picture — with the 1st ECG on TOP. I’d add the following thoughts to Dawn’s comments.
ECG #1 (TOP tracing in my Figure) — As per Dawn, there is marked sinus tachycardia (~120/minute) + evidence of extensive anterolateral MI.
I thought the QTc was increased in this tracing. The clinical utility of assessing a specific millisecond duration for the QTc in the setting of obvious recent STEMI + marked tachycardia (as we have here) is questionable. That said — there IS already T wave inversion in most chest leads — and measurement of the QT taking into account the end of these T waves yields a value over 60% of the R-R interval in a number of leads. Correcting for rate — this makes for a significantly prolonged QTc by my calculation. Then again — acute ischemia/infarction is a common reason for QTc prolongation (sometimes marked prolongation) — so my approach to this patient is not at all changed by whatever QTc one agrees on.
A KEY to this case is the History! The patient’s chest pain started “over 24 hours ago”. We are not told whether this 44-year old man had any prior history of coronary disease. As a result — we have NO idea IF: i) The chest lead QS complexes (and fragmented Q wave in lead V5) + the inferior Q in II and aVF (and possibly also in lead III) are new or old from months or years earlier; ii) Perhaps these Q waves and QS complexes formed 24+ hours ago, at the onset of this patient’s symptoms? — or, iii) Perhaps these Q waves/QS complexes are all new (ie, developing within the past very few hours). It is not commonly appreciated that Q waves have been shown at times to develop in as little as 1-2 hours. That said — my guess is that this patient, who was found on cath to have “severe multi-vessel disease” — probably had either prior inferior and/or anterior infarction — on top of which is now superimposed an extensive new event that is still actively evolving (since this patient apparently is still having chest pain!).
In addition to marked ST segment coving and elevation — there is T wave inversion — which is seen in multiple leads (ie, leads I, aVL, V2-thru-V5). This suggests some component of spontaneous reperfusion. That said — persistence of this patient’s chest pain (even though symptoms began more than 24 hours ago) is definite indication for prompt cardiac cath to clarify the anatomy — and for PCI consideration of what may be potential persistent coronary occlusion. It is not surprising that the “culprit artery” is the LAD (Left Anterior Descending) artery. Although not specified in the cath report we are given — ST elevation being maximal and beginning as soon as lead V2 + reciprocal inferior lead changes + acute changes in lead aVL in ECG #1 combine to suggest a proximal LAD lesion.
==================================
ECG #2 (BOTTOM tracing in my Figure) — 10 minutes later the ECG is repeated, now with posterior leads V7, V8 and V9.
Practically speaking — Time need not have been spent getting posterior leads. There is nothing in ECG #1 to suggest acute posterior involvement (ie, no acute inferior ST elevation — no tall anterior R waves — and no anterior ST depression). If time was at a premium, it would have been better spent not getting these posterior leads. (Instead — Seeing what leads V4, V5 and V6 now show would have provided much more insight as to how rapidly this infarct was evolving ... ).
Otherwise, as per Dawn — ECG #2 (done just 10 minutes after ECG #1) now shows much more marked ST elevation in lead aVL and a much deeper Q wave. In addition — inferior lead reciprocal changes are much more marked than they were 10 minutes earlier — suggesting that for whatever prior injury this patient may have had — he was still in the process of actively evolving an extensive STEMI. Fortunately, the treatment team was prompt in their interventions!
Ken Grauer, MD www.kg-ekgpress.com [email protected]