
Submitted by Dawn on Fri, 06/28/2024 - 17:12
The Patient
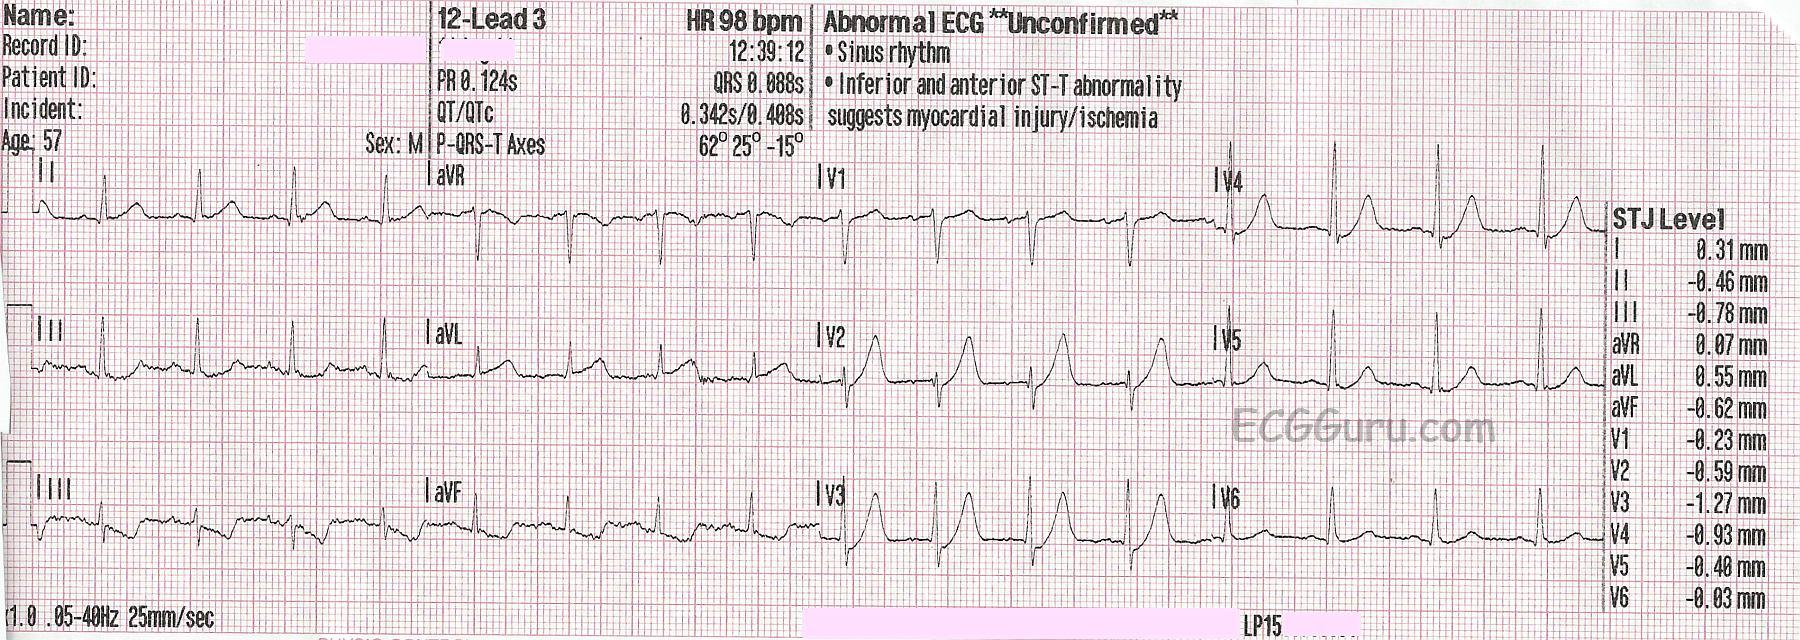
This ECG is from a 57-year-old man complaining of sub-sternal chest pain for 30 minutes. EMS found him pale, diaphoretic, and anxious. We don't have other clinical information or past medical history.
The ECG
The rhythm is normal sinus rhythm at 98 bpm. The QRS is narrow, and the PR and QTc intervals are within normal limits. In precordial leads V2 through V4, ST segments begin at a J point that is below the baseline by one small block (the computer reads all precordial leads as having a small J point depression). From those depressed J points, there are upsloping ST segments leading into hyperacute T waves.
This is called de Winter T wave pattern, and it is a sign of critical proximal occlusion of the left anterior descending coronary artery. Dr. Robbert de Winter, et al, described this pattern in a letter to the editor of the New England Journal of Medicine in 2008. Since then, it has been estimated to occur in about 2%-3.4% of acute occlusive myocardial infarctions. It has been seen in occlusions of other major arteries, but by far most cases are seen in LAD occlusion. This should not be considered to be an "impending M.I.", but rather a STEMI equivalent, warranting emergent treatment in a cath lab.
In this ECG, we see a curving upward of the ST segment in aVR, with very slight STE noted by the computer. ST elevation in aVR is a common finding with proximal LAD occlusion. There is also subtle ST elevation in I and aVL with reciprocal ST depression in II, III, and aVF without hyperacute T waves, common when the occlusion is so proximal it affects the obtuse marginal branch of the circumflex or first diagonal branch of the LAD.
The J point changes of the de Winter pattern are seen with hyperacute T waves. T waves are considered hyperacute if they are larger than normal for the lead they are seen in. When we say, "large", it refers more to the width of the base of the T waves, and the space contained within the T wave, although they can be quite tall sometimes. A tall, but narrow and pointed T wave would be more indicative of hyperkalemia than of de Winter pattern.
Follow up
Unfortunately, we don't have follow up information on this patient, other than he arrived at the Emergency Department alive and was scheduled for the cath lab.
Rate this content:
All our content is FREE & COPYRIGHT FREE for non-commercial use
Please be courteous and leave any watermark or author attribution on content you reproduce.
Comments
Clinical Implications of deWinter T Waves
Today's case by Dawn illustrates an important ECG pattern to recognize = deWinter T waves. In the interest of expanding on Dawn's discussion — I've excerpted considerable portions from my ECG Blog #183 (https://tinyurl.com/KG-Blog-183 ) that discusses a case of this entity.
In 2008 — Robert J. deWinter and colleagues (Drs. Verouden, Wellens, and Wilde) submitted a Letter to the Editor to the New England Journal of Medicine (N Engl J Med 359:2071-2073, 2008) — in which they described a “new ECG pattern” without ST elevation that signifies acute occlusion of the proximal LAD (Left Anterior Descending) coronary artery.
— The authors recognized this pattern in 30 of 1532 (~2%) patients with acute anterior MI. Cardiac cath confirmed LAD occlusion in all cases — with ~50% of patients having a "wraparound" LAD. Left mainstem occlusion was not present.
— This was the authors’ original description of the new ECG pattern: “Instead of the signature ST-segment elevation — the ST segment showed 1-3 mm of upsloping ST depression at the J point in leads V1-to-V6 — that continued into tall, positive symmetrical T waves”.
— The QRS complex was usually not widened (or no more than minimally widened).
— Most patients also manifested 1-2 mm of ST elevation in lead aVR.
— NOTE: I’ve adapted the attached Figure from the original de Winter manuscript, published in this 2008 NEJM citation. ECGs for the 8 patients shown here were obtained between 26 and 141 minutes after the onset of symptoms
In their original 2008 manuscript — de Winter et al went on to describe the following additional features:
— “Although tall, symmetrical T waves have been recognized as a transient early feature that changes into overt ST elevation in the precordial leads — in this group of patients, this new pattern was static, persisting from time of the 1st ECG until the pre-cath ECG.”
— Hyperkalemia was not a contributing factor to this ECG pattern (ie, Serum K+ levels on admission were normal for these patients).
NOTE: Technically speaking — the de Winter T wave pattern as described in 2008 by de Winter et al differs from the finding of simple “hyperacute” anterior T waves — because ECG findings with a strict de Winter T wave pattern persist for an hour or more until the “culprit” LAD vessel has been reperfused. Also, as illustrated in the example ECGs taken from the de Winter manuscript that I show in the attached Figure — there should be involvement in all 6 chest leads with the strict de Winter pattern, with most leads showing several mm of upsloping J-point ST depression and giant T waves.
===========================
MY Observations regarding De Winter T Waves:
Over the past decade — I have observed literally hundreds of cases in numerous international ECG-internet Forums of deWinter-like T waves in patients with new cardiac symptoms.
— Many (most) of these cases do not fit strict definition of “de Winter T waves” — in that fewer than all 6 chest leads may be involved
— J-point ST depression is often minimal (if present at all) in many of the chest leads — and, giant T waves are limited.
— ECG changes in many of these cases are not “static” until reperfusion, as was initially reported in 2008 by de Winter et al. Nevertheless, cath follow-up routinely confirms LAD occlusion.
MY "Take":
I believe there is a spectrum of ECG findings, that in the setting of new-onset cardiac symptoms is predictive of acute LAD occlusion as the cause. What will be seen on the ECG depends greatly on when during the process the ECG was obtained. While many of these patients do not manifest “true de Winter T waves” (because their ECG pattern does not remain static until reperfusion by coronary angioplasty) — for the practical purpose of promptly recognizing acute OMI — I don’t feel ( = my opinion) that it matters whether a “true” de Winter T wave pattern vs simple “hyperacute” T waves (that are deWinter-like) is present. As to today's case, although I completely agree that the clinical picture here suggests deWinter T waves — Giant T waves are really only present in 2 leads (leads V2,V3) — and ST-T wave changes are minimal in leads V5,V6.
P.S. — The following is a 3-minute Audio Pearl that summarizes my comments on today's case ( https://dl.dropboxusercontent.com/s/y03g4vnr4ww7r1c/z-ECG%20Audio%20Pear... )
Ken Grauer, MD www.kg-ekgpress.com [email protected]
Q Waves in V1-V3 Leads
I can see a tiny Q wave in V2 and maybe an even smaller one in V3 developing. qR waves in v1-v3 are never normal, especially in the context of a ?MI.
It may not be as significant as the HATWs/De Winter T-Waves - but it further supports the diagnosis of OMI. Since this patient had only been presenting with CP for 30 minutes, it would be interesting to see the evolution of those Q waves.
It is also worthy of note that these are of qR morphology (can be an acute finding), whereas a QS morphology more commonly associated with the ‘LV Aneurysm/ Old Infarct’ picture.
From my understanding, Q waves indicate a greater transmural infarct, and carry a worse prognosis in MI patients.
Hope this adds additional value to this great case!
Jack Cahill
JCahill
Medical Student - UK