
Submitted by Dawn on Tue, 05/24/2016 - 15:17
This ECG was obtained from a man in his 70’s. We have no other clinical information. It is interesting for several reasons.
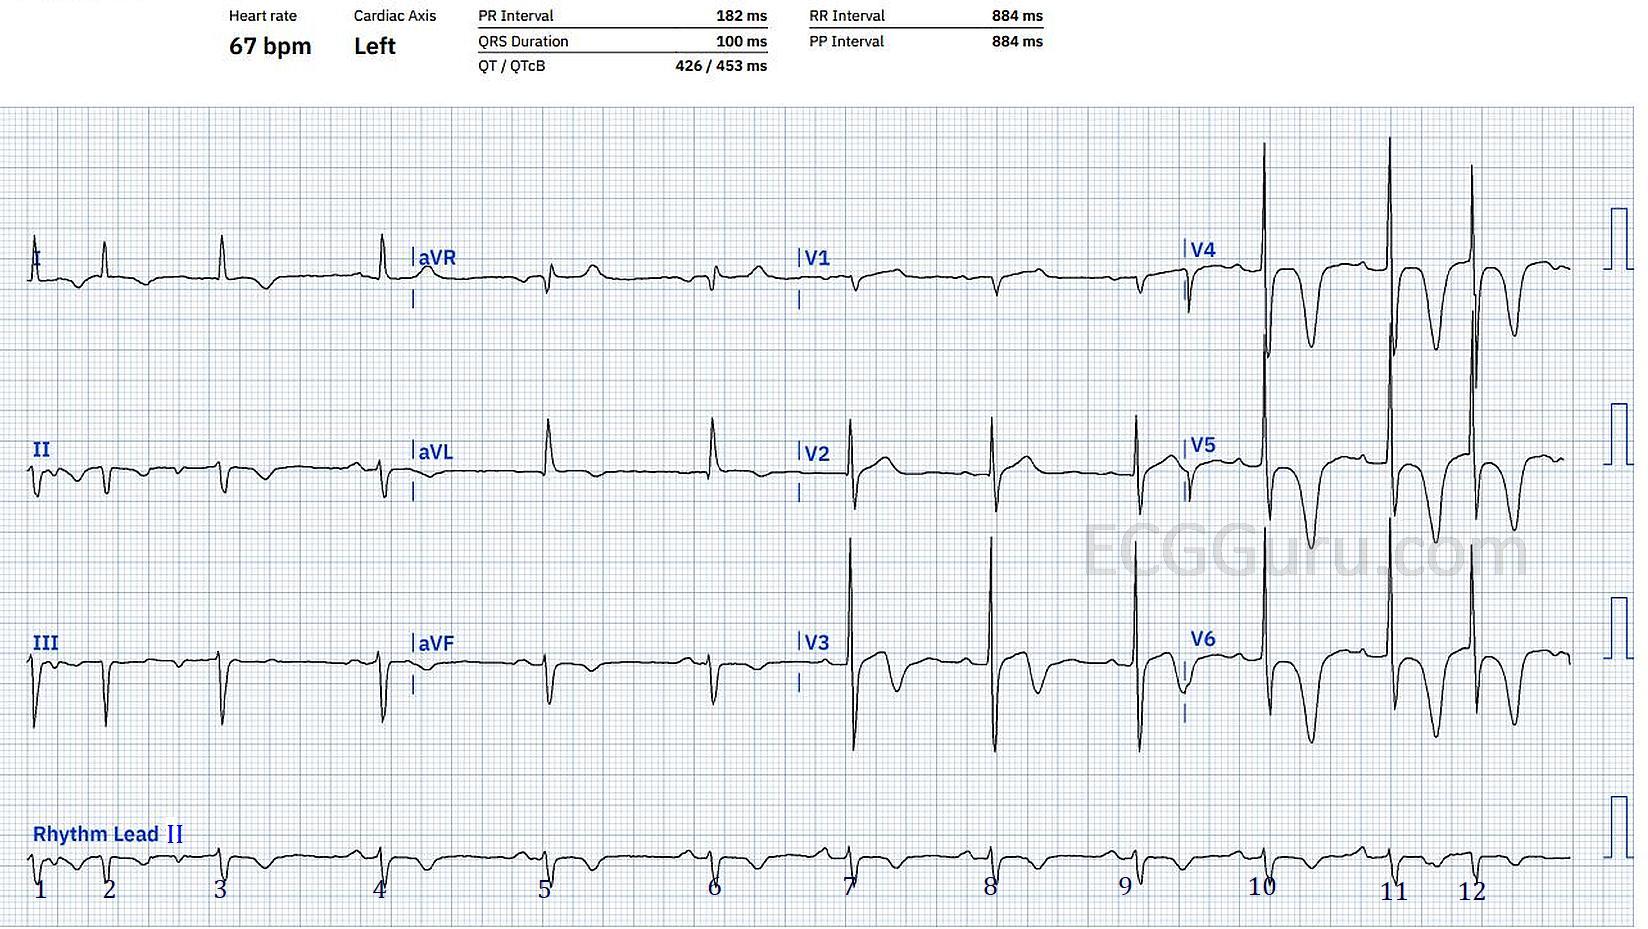
Giant T wave inversions The most obvious abnormalities we see on first inspection are the deeply inverted T waves in Leads V3 through V6. The T wave in V3 is biphasic. There are also T wave inversions in all of the limb leads except aVR. The precordial T wave inversions are called “giant T wave inversions” because they are 10 mm or more in depth. There are many causes of giant T wave inversions, including, but not limited to: myocardial ischemia, coronary artery disease and reperfusion, pulmonary edema, massive pulmonary embolism, subarachnoid hemorrhage, apical hypertrophy, post-tachycardia syndrome, and post-pacing syndrome.
What else? There are no Q waves or ST elevations. The ST segments are not entirely normal in shape, being flattened in most lead. The frontal plane axis is left. Even though the ECG almost meets criteria for left ventricular hypertrophy, by exclusion we would call this anterior fascicular block (left anterior hemiblock). Obviously, it would help greatly if we had some history and clinical information to accompany this ECG.
If the patient has complained of chest pain which has now resolved, we would be concerned about reperfusion T waves, or Wellen’s Syndrome. Usually, the T wave changes of Wellen’s Syndrome are prominent in V2 and V3, but we would consider the possibility of a not-so-correct electrode placement. The reperfusion T wave inversions of Wellen’s Syndrome are a dire warning: the left coronary artery has significant disease, and is intermittently occluding. Wellen's Syndrome means that acute anterior wall M.I. is threatening.
The rhythm is also interesting. From beat 4 until beat 10, the rhythm is fairly regular, but with slight variations in rate. Beats 7 and 11 may have slightly different P waves, but only to those who scrutinize very closely. Beats 1, 2, and 3 are irregular and have inverted P waves in the inferior leads, a sign that they are being conducted in a retrograde direction. The PR intervals seem to be shortening in beats 2 and 3, but there is not enough strip at that end to know for sure what is happening. Then, at the end of the strip, beat 12 arrives so early that we can’t evaluate the P wave, as it is buried in the T wave of beat 11.
For comparison There is another ECG with giant T wave inversion on our site that you might like to look at for comparison purposes. Dr. Ken Grauer also has a nice example, with thorough discussion, on his website. I will look forward to any comments from our experts and our readers.
Related Terms:
Rate this content:
All our content is FREE & COPYRIGHT FREE for non-commercial use
Please be courteous and leave any watermark or author attribution on content you reproduce.
Comments
Giant T Waves of Uncertain Cause
Interesting case posted by Dawn — for which we unfortunately do not have follow-up … I’ll add to Dawn’s discussion by making the following comments:
The Rhythm — I see an underlying sinus mechanism for beats #4,5,6,7,8,9,10,11. The P-P interval varies for these 8 beats — so I’d qualify the underlying rhythm as sinus arrhythmia. I don’t think we see enough of the rhythm here to know if the negative P waves in inferior leads represent retrograde atrial conduction or PACs. I favor the latter, since beats #2 and 12 are quite premature, and I don’t see obvious reason for why this should represent retrograde conduction. But there is some baseline artifact for the first few beats on this tracing, so we really cannot say for sure. My guess is sinus arrhythmia with PACs …
Transition is early in the chest leads (the R already becomes taller than the S wave is deep by lead V2). Assuming this is not due to lead malposition — there really is generous R wave amplitude beginning with lead V3. Among the many criteria for LVH is one stating R ≥18mm in V6 — and that criterion is satisfied here — so I would call LVH here.
The 2 links to my work that Dawn provides at the bottom of her comment I believe cover the differential diagnosis of Giant T waves. Since the history and other investigation results are not known — we remain in the dark as to the cause of these T waves in this case. But the QT interval does not seem nearly as long as I’d expect with a primary CNS etiology — and the presence of the steep descent of the biphasic T wave in V3 makes me highly suspicious of coronary disease. This is not Wellens Syndrome — as that diagnosis should not be made in association with LVH and with the unusual R wave progression pattern we see here — but it could reflect ischemia and/or reperfusion T waves following an event. And/or the dramatic R wave appearance may reflect cardiomyopathy. I wish we could know the answer …
Ken Grauer, MD www.kg-ekgpress.com [email protected]