Displaying 11 - 19 of 19
Dawn's picture

ECG Teaching Series: Atrial Flutter

In the first ECG shown, we see an irregular tachydysrhythmia.  He has had periodic episodes of rapid heart rate since the age of 19, but is in good health otherwise.  He is on Flecainide, 200 mg per day.   The rhythm might look like atrial fibrillation to many people, but there are signs of regular, fast flutter waves (arrows).  The irregularity is caused by variable conduction of the atrial flutter.  The QRS is slightly widened, possibly due to the Flecainide, a sodium-channel blocker which slows conduction.

The patient usually felt palpitations during these periods of rapid heart rate, but had no syncopal episodes, chest pain, or other concerning symptoms.


The next ECG shows more apparent flutter waves.  The ST elevation is due to artifact which can occur on manually-obtained ECGs due to the type of filtering.  It is not uncommon to see dramatic ST elevation on manually-obtained rhythm strips which disappears when a standard filtered 12-Lead is performed.   On other ECGs, the patient also had periods of NSR and frequent PACs. (ECGs not shown).


The third ECG was obtained after the patient underwent successful radiofrequency ablation for atrial fib / atrial flutter.  He is now off antiarrhythmics, and feeling well.

For instructors and students, this is a nice "before and after" series to illustrate successful ablation.

Dawn's picture

Supraventricular Tachycardia

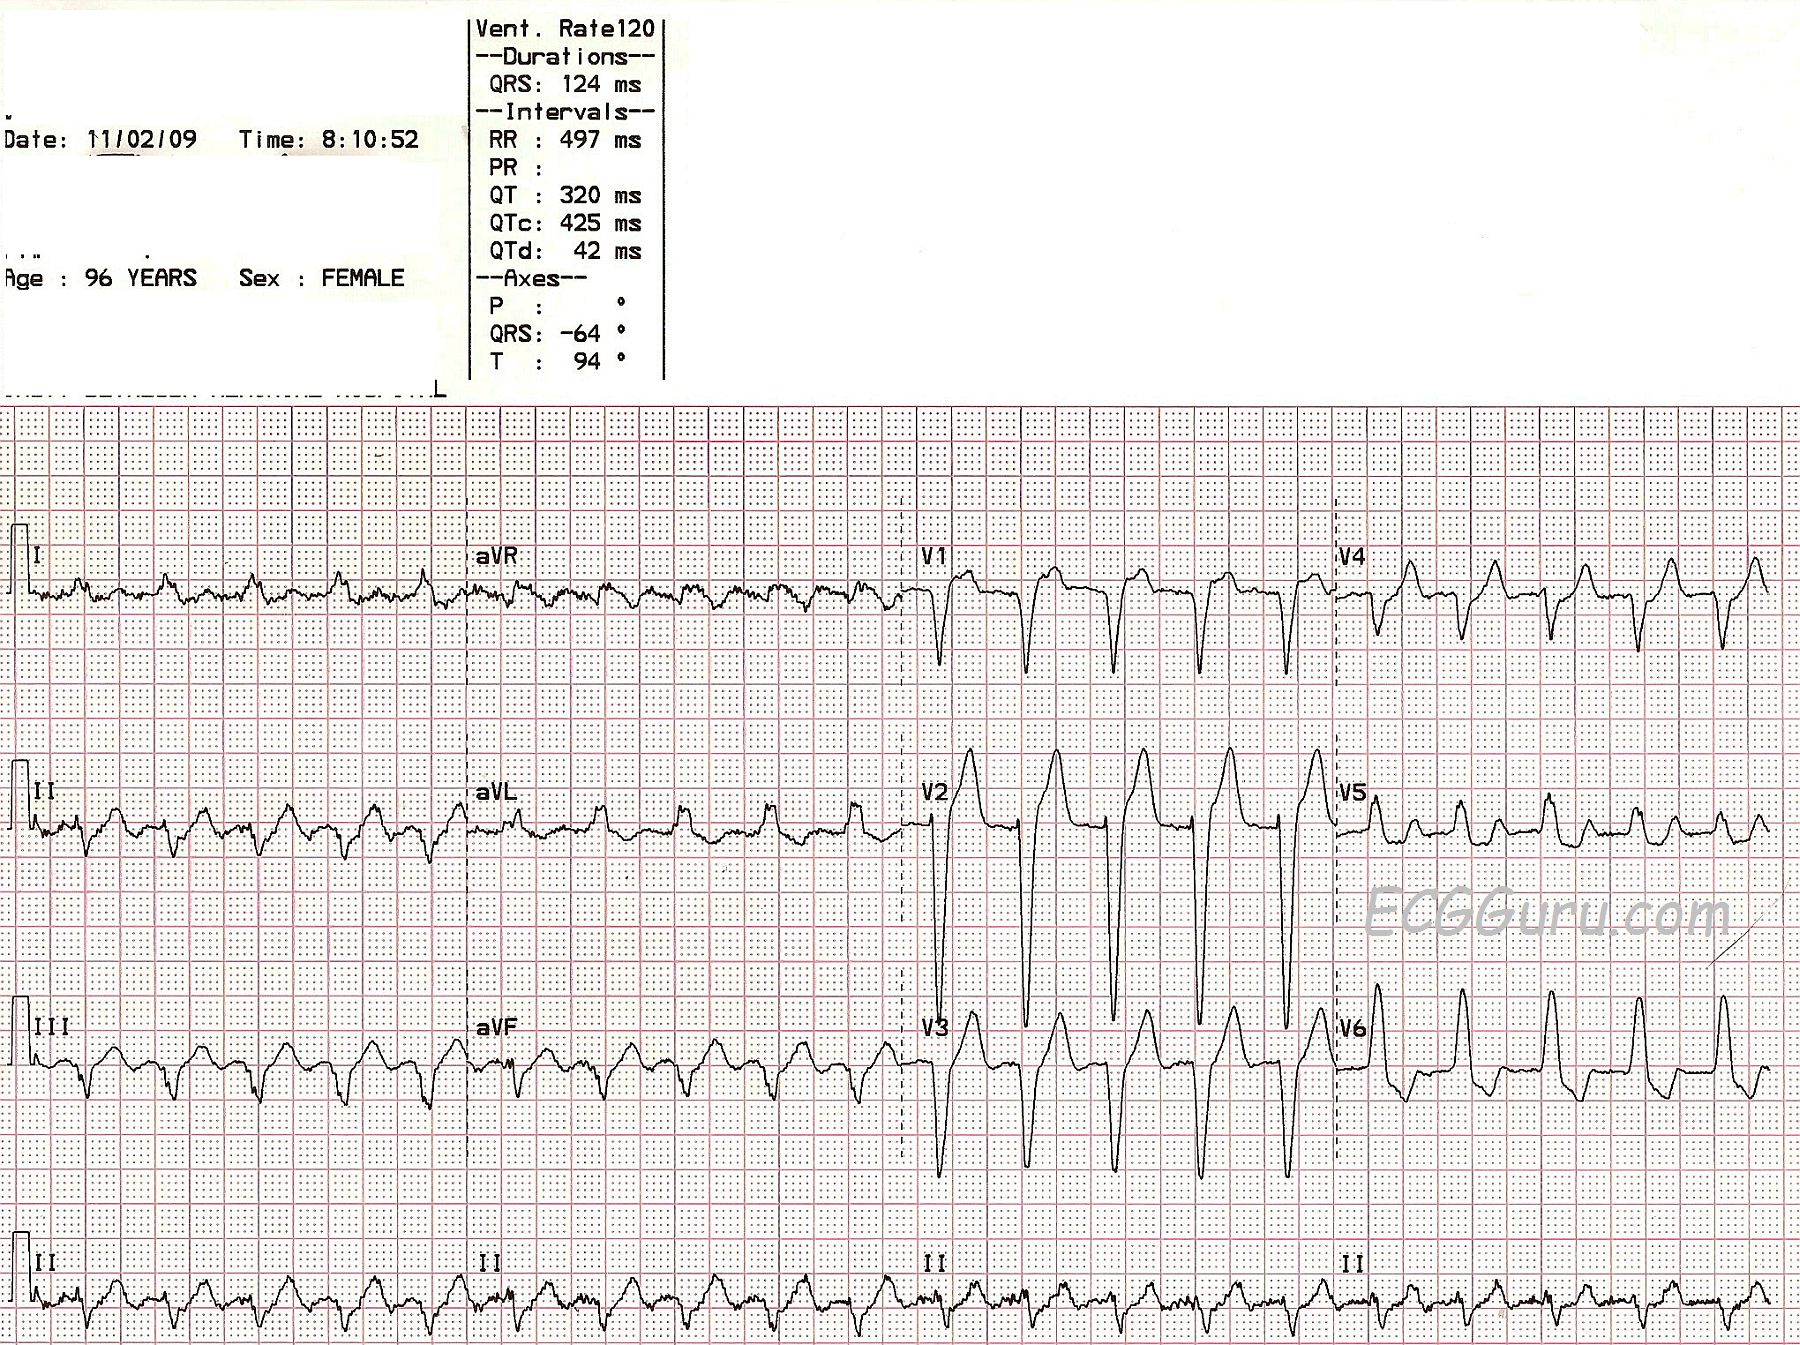
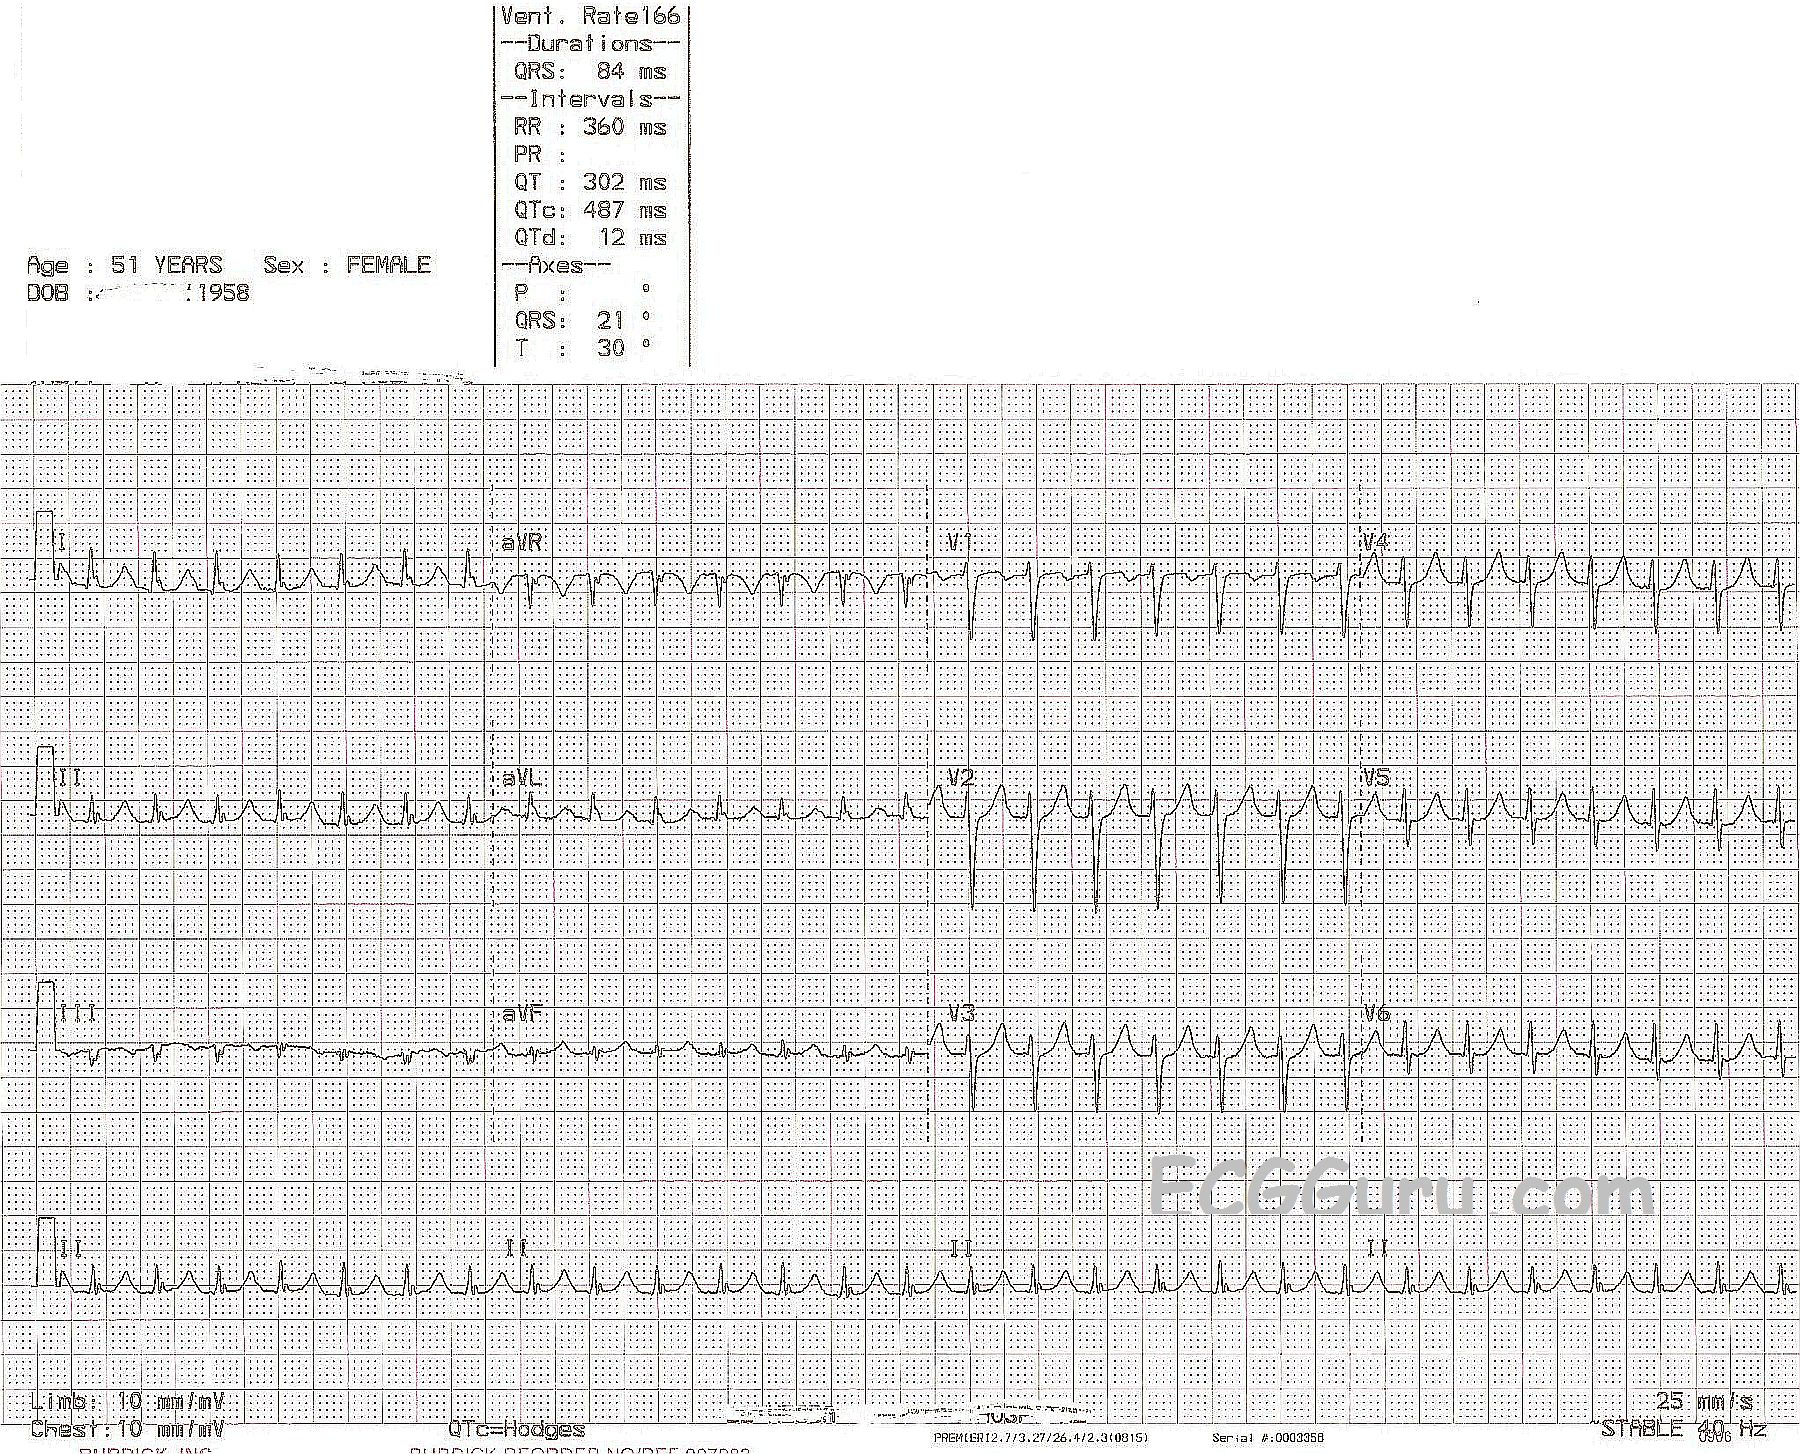
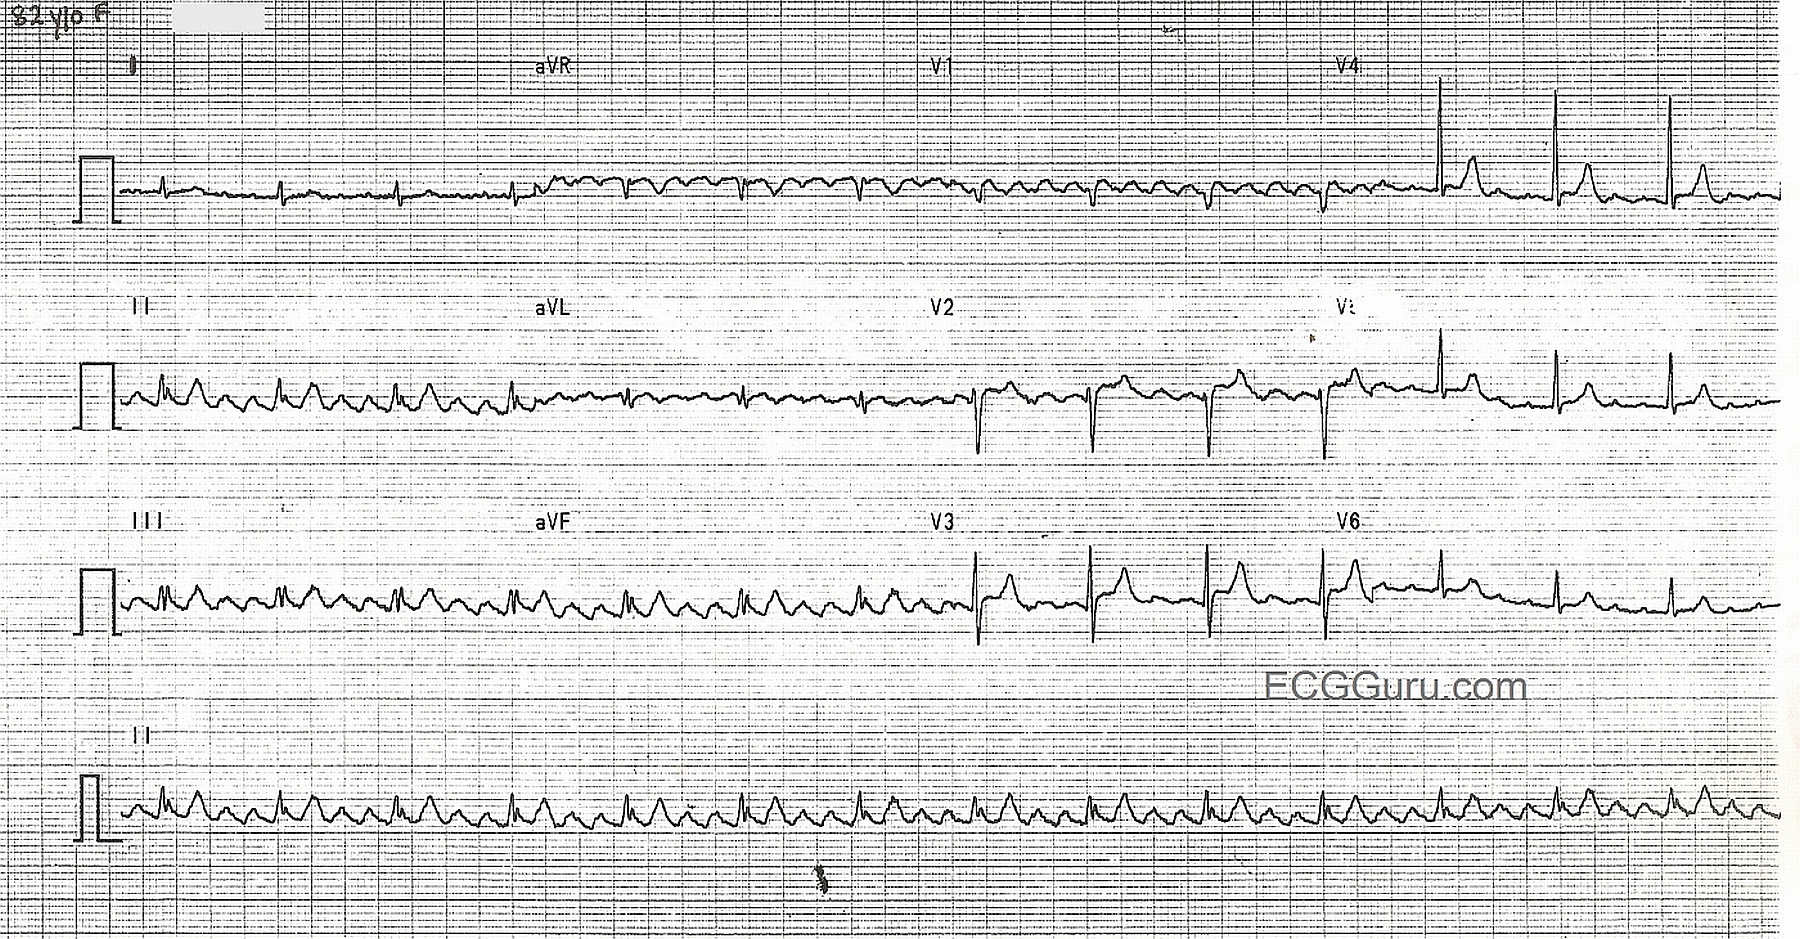
This example of supraventricular tachycardia is from a 51-year-old woman who presented to the Emergency Dept. with a complaint of palpitations.  We do not have any more clinical information for her.  We know this tachycardia is supraventricular because the QRS complexes are narrow.  The term, "supraventricular tachycardia", or "SVT" actually describes many different rhythms with many different mechanisms and causes.  It would help a great deal to see the beginning (or end) of this rhythm to determine if the onset was sudden (paroxysmal) - or gradual.  Sinus rhythms tend to speed up gradually - picture a patient on a treadmill getting a faster and faster heartrate.  Take the patient off the treadmill, and the rate gradually decreases.  This reflects normal function of the sinus node.

SVT with paroxysmal onset indicates a re-entry mechanism, where the impulse travels from the atria to the ventricles by one pathway, but is able to return in a retrograde fashion, following a second pathway in the atria or AV node, and reenter the ventricles, depolarizing them antegradely, causing another QRS.  The atria are usually depolarized retrogradely as well.   Reentry can occur in the sinus node, in the AV node, or around the AV node via accessory pathways in the atria.  For a very clear and concise discussion of AV nodal reentry tachycardia (AVNRT), go to this Life in the Fast Lane link.  There is also a great discussion of AVNT and pre-excitation syndromes, including Wolff-Parkinson-White syndrome, at LITFL.

In this ECG, we do not know the patient's clinical situation,  and we haven't seen the onset of this rhythm.  The rate is 166 / min.  In order for her sinus node to naturally reach this rate, we can assume she would have some visible reason for tachycardia:  extreme anxiety, blood loss, hypoxia, exercise, etc.  An "inappropriate" sinus tachycardia is a possibility, but not the most common thing.  If she describes this rhythm as having a sudden onset, the most common and most likely diagnosis is AVNRT, also called SVT or PSVT.  

The presence of retrograde P waves can aid in the diagnosis of AVNRT.  Retrograde P waves are negative in Leads II, III, and aVF.  They can occur before, during, or after the QRS.   In this ECG, we cannot see P waves, either before or after the QRS.  Some of the QRS complexes (limb leads) have a small notch at the end, but it does not look like a typical retrograde P wave in II or aVF.

If sinus tachycardia can be ruled out, it is safe to treat this rhythm with Valsalva maneuvers and adenosine, and then investigate the cause.

Dawn's picture

ECG Basics: Atrial Flutter With Variable Conduction

This is a good teaching strip for showing your students how to "see" the atrial activity separately from the ventricular activity.  The P waves, also called flutter waves, march out regularly at a rate of around 300/minute, which is typical of atrial flutter.  The conduction ratio is variable, and the intervals between the conducted P waves and the QRS complexes vary, as well, reflecting changing refractoriness of the AV node.  It is easy with this strip to "march out" the flutter waves, through the QRS complexes, and to show your students how the flutter waves are either visible, or "hiding" behind a QRS complex.  We have featured several atrial flutter examples on the ECG Guru recently.  Remember, you can also obtain rhythm strips for your basic students by cropping out the rhythm strips often found at the bottom of 12-lead ECGs.

Dawn's picture

Atrial Flutter With 2:1 Conduction

Unfortunately, we have no clinical information on this patient, not even age or gender, as the ECG machine defaults to "Age 60".  The rhythm is a supraventricular tachycardia at a rate of about 260/min. with 2:1 conduction, resulting in a heart rate of about 130 / minute.  Some would call this atrial tachycardia, and some atrial flutter.  Since the reentrant pathways involved in the two rhythms are different, it is probable that an electrophysiologist could determine the exact location of the pathway in the EP lab.  Without benefit of this test, we use our best guess.  We will leave it to our more advanced Gurus to debate the origins of this rhythm.

The fast P waves are best observed in the limb leads, with one P wave occuring in the QRS complex.  If you ignore the QRS complexes for a moment, you can draw an unbroken line through them, uncovering the flutter waves.  SVTs with 2:1 conduction can easily be mistaken for sinus tachycardia.  Always suspect and look for atrial flutter when the heart rate is around 150 / minute.  A 12-lead is a big help, as flutter waves show up better in some leads than in others.  Another way to uncover atrial flutter is to slow the rate with vagal maneuvers or medication to decrease the conduction ratio, and observe several flutter waves in a row without QRS complexes.

Of even more concern to this patient may be the ST elevations - slight but noticeable - in Leads V2 - V4, and possibly I and aVL.  The J points (the beginning point of the ST segment) can be obscurred by the P wave lying beneath the QRS, and it may be difficult to judge ST elevations.

We expect this ECG to elicit many opinions - possibly different from ours.  Please add your comments below.  We will enjoy the discussion.

Dawn's picture

Atrial Flutter With Variable Conduction

This ECG, showing atrial flutter with variable conduction, has good teaching points for all levels of students.  The atrial rate is between 250 and 350 bpm, actually very close to 300 bpm, which is typical of atrial flutter.  The flutter waves create a "sawtooth" pattern in most leads, but not all.   One good teaching point, always evaluate an ECG in as many leads as possible and practical, since the signs you are looking for may not be very obvious in all leads.  In this case, V4, V5, and V6 have subtle flutter waves, and a faster ventricular rate, making the "sawtooth" pattern difficult to discern.

The rhythm appears irregularly-irregular, mimicing atrial fibrillation.  But, on closer inspection, one can usually find several distinct R-to-R intervals in atrial flutter with variable conduction.  In this ECG, conduction ratios vary from 2:1 to 8:1, but the R-to-R intervals vary according to the ratio.  Every time the ratio of P waves to QRS complexes is 4:1, for example, the R-to-R will be approximately .80 seconds (or a multiple of the P-to-P interval).

This ECG also teaches the beginner student to "march out" the P waves (flutter waves) THROUGH the QRS complexes and T waves, as the atria do not pause their fluttering while the ventricles depolarize and repolarize.  The Lead II rhythm strip at the bottom illustrates this quite well.

For your more advanced students, this patient has low voltage, and we do not have patient information which would explain this in this particular case.  The ventricular axis is close to 0 degrees, making aVF nearly isoelectric.  You may have to magnify the strip for your students to find the QRS.  Remind them that all four channels on this ECG were run simultaneously.  So, if a QRS appears in aVR and aVL, it most certainly is present in aVF as well.

There are pathological Q waves in Lead III, but it is very difficult to evaluate for them in aVF, so their significance is unknown.

We eagerly await comments from our members.  What do you think are the teaching points of this ECG - basic, intermediate, and advanced?

Dawn's picture

Atrial Flutter

This nice example of atrial flutter offers many teaching opportunities. "Sawtooth" flutter waves are readily visible in Leads II, III, avF, and V1, typically good "P wave" leads.  Other leads show small, discreet P waves that the beginning student might not recognize as flutter waves because they don't produce the sawtooth pattern.  The P waves' rate, approximately 360/min., gives them away as atrial flutter.  This is also a good example of a constant 4:1 conduction, resulting in a regular QRS rhythm and regular pulse, at a rate of about 90/min.  This demonstrates that not all narrow-complex rhythms between 60 and 100 bpm are "NSR".  The low voltage in the limb leads makes this a good ECG to demonstrate that the flutter waves are regular and do not pause when the QRS happens, illustrating the separate actions of the atria and the ventricles.  For students just learning 12-lead interpretation, this ECG serves to show that acute ST elevation M.I. is not the only valuable information that can be obtained from a 12-Lead, and that some leads are better than others for showing dysrhythmias.

jer5150's picture

Jason's Blog: ECG Challenge of the Week for Jan. 13th - 20th.

Patient's clinical data:  46-year-old black man

The computer's interpretation was "undetermined rhythm". 

What is the source and mechanism of this rhythm?


Dawn's picture

Atrial Flutter With PVCs

This ECG shows a nice, clear atrial flutter with 4:1 conduction.  Also, there are frequent PVCs. Good for students who have mastered the criteria for the basic arrythmias and who need to see combinations.  That is, PVCs are not only seen with NSR, and it is important to state the underlying rhythm.  For your more advanced students who understand how to plot frontal plane axis, the axis of the PVCs is nearly straight up - a very strong argument for the ventricular origin of the beats.

Dawn's picture

Atrial Flutter With 1:1 Conduction and Rate-dependent Right Bundle Branch Block

The first ECG is from an active, otherwise healthy 66-year-old man who experienced a sudden onset of symptomatic tachycardia. He presented to the Emergency Dept. feeling (understandably) very anxious, with poor perfusion to his skin, chest discomfort, and palpitations. As the ED staff prepared to electrically cardiovert him, he spontaneously converted to normal sinus rhythm at a rate of 93 / min. and a QRS duration of 90 ms.

After a normal diagnostic cardiac cath, he was sent to the EP lab and the circuit responsible for this rhythm was successfully ablated. He was discharged in good condition the next day.

This is a good ECG for all levels of students. For beginners, it shows that atrial flutter is one of the rhythms we call "SVT", and it does not always conduct in a variable rate, or a rate that allows "sawtooth" P waves to show easily. You can show them that the "sawtooth" pattern, brought about by P waves that are 250 - 350 per minute, is still there if one ignores the QRS complexes for a moment. This is a great ECG for discussions of rate and cardiac output, and making decisions regarding treatment based on the patient's hemodynamic condition. For more advanced students, this ECG can lead to a discussion of the accessory pathways and re-entrant pathways that cause rapid rhythms. For RBBB criteria, click HERE.

The second ECG shows the same patient after spontaneous conversion to sinus rhythm.  The bundle branch block has disappeared, as it was rate-dependent.

Pages

All our content is FREE & COPYRIGHT FREE for non-commercial use

Please be courteous and leave any watermark or author attribution on content you reproduce.