
Submitted by Dawn on Tue, 11/12/2019 - 23:56
The Patient: An elderly man presents with chest pain, pallor, diaphoresis and weakness.
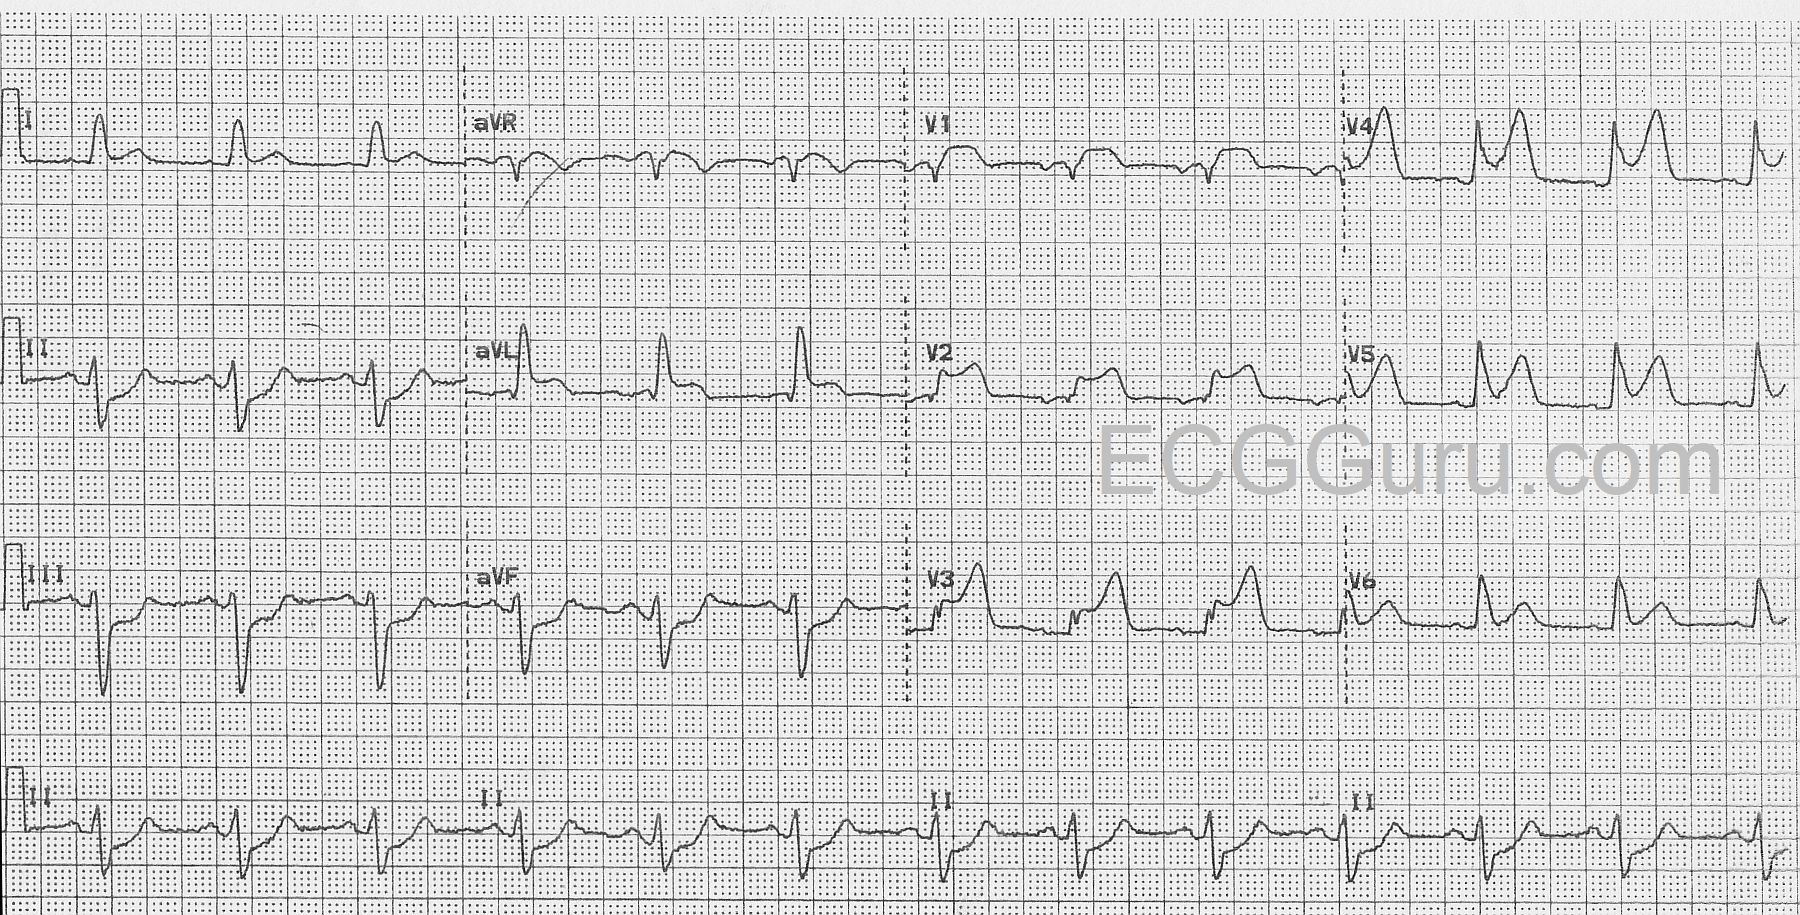
The ECG: The rhythm is normal sinus at a rate of about 76 bpm with normal intervals. The QRS complexes are wide at about .14 seconds (140 ms). There is ST segment elevation in all precordial leads, except for possibly V6. The shape of the ST segments in the anterior wall range from coved upward in a “frowning” shape (V1) to very straight (V5 and V6). There is also ST elevation in aVL with ST straightening in Lead I. There is ST depression in the inferior leads, II, III, and aVF. Lead II is equally biphasic while I and aVL are positive, indicating an axis that is shifted slightly to the left. With his symptoms and this alarming ECG, he was sent promptly to the cath lab.
Interpretation: The rather obvious ST-elevation M.I. is extensive, covering the entire anterior wall, and extending into the high and low lateral walls . This was confirmed in the cath lab, as the patient had an occlusion of the left anterior descending artery near the bifurcation of the circumflex. The wide QRS meets the criteria for left bundle branch block (wide QRS, negative QRS in V1 and positive QRS in V6 and Lead I). However, it doesn’t have the “look” of LBBB with the low-voltage seen in the anterior wall. After the offending artery was opened and stented, the wide complex became narrow and was considered to be an interventricular conduction delay that was due to the ischemia. The ST depression in the inferior wall is most likely reciprocal.
Take-home points: “Normal sinus rhythm” does not mean that everything is “normal”. Also, the SHAPE of the ST segment is as important as the elevation. ST segments can be elevated in conditions other than acute M.I., and ST segments can be quite low and still be very abnormal. Coved upward or straight ST segments are indicative of M.I.
Related Terms:
Rate this content:
All our content is FREE & COPYRIGHT FREE for non-commercial use
Please be courteous and leave any watermark or author attribution on content you reproduce.
Comments
Acute Proximal LAD Occlusion (STEMI - LAHB)
The cause of this elderly man’s new-onset chest pain is obvious from his ECG. I’ll add the following thoughts to Dawn’s comments:
1) As noted — the rhythm is sinus. The PR interval is normal — but the QRS complex is wide. I measure a bit less than Dawn = 0.12 second duration to my eye (in leads II and III, which are the leads where I see the QRS as its widest). I would not classify the conduction defect as LBBB (Left Bundle Branch Block) — because the expected predominantly negative QRS complexes in anterior leads are not seen (just a shallow S wave in lead V1 — and really no other negative deflections in the other chest leads). Instead — QRS morphology to me looks most like a combination of LAHB (Left Anterior HemiBlock) + the slight QRS widening that can often be seen during the early hours of large acute infarction. I believe criteria for LAHB are satisfied — because there is a predominantly negative QRS complex in each of the 3 inferior leads (ie, in lead II, I count 3 boxes positive vs 6 negative). This is relevant — because I’m always on the lookout for new LAHB, with or without associated RBBB in the setting of acute, proximal LAD occlusion.
2) The Q wave in lead aVL is real and abnormal. While not overly deep — it is clearly much wider-than-it-should-be in this lead. This is not a “normal septal q wave”.
3) ST elevation is marked! This begins with impressive (3mm) ST elevation as early as in lead V1 — and persists to lead V5. ST-T wave appearance is hyperacute in leads V2-thru-V6. This suggests extensive involvement of myocardium served by the LAD (Left Anterior Descending) coronary artery.
4) The suggestion of very proximal LAD occlusion is further supported by: i) Such marked ST elevation that begins as early as in lead V1; ii) Reciprocal ST depression in each of the inferior leads (which is often not seen with mid- or distal LAD occlusion); and, iii) Significant ST elevation also in lead aVL.
Ken Grauer, MD www.kg-ekgpress.com [email protected]
Some Additional Thoughts
Dawn...
I agree with Dr. Grauer in that the QRS intervals look to me to be right at 0.12 sec. There is no question that this is a proximal LAD occlusion due to the marked involvement of V1 and aVL.
The blood supply for the right bundle branch and the anterior fascicle come from branches of S1. I certainly don't see an RBBB but I do see an LAFB pattern which can certainly occur without RBBB. It's possible in this case that the right bundle has an additional blood supply (vascular variations are NOT rare). I'm not convinced that it is a real block, however.
The QRS normalized AFTER the stent was placed. This will not happen after a true bundle branch block. I have problems with the term "block" as in the last "B" of RBBB and LBBB. There is usually no block at all and "block" - physical or functional - is not what causes the characteristic morphology of what we call RBBB and LBBB. It is simply the fact that one ventricle (in THIS case, the right ventricle) has managed to activate BEFORE the other ventricle. All it takes is for one of the bundle branches to arrive at its septal exit at least 60 msec before the other bundle.
This patient was elderly and probably had some pre-existing disease of the left bundle - either ischemic or due to fibrosis. It would not take much ischemia to slow conduction in the left bundle branch. I think the ischemia slowed the left bundle allowing the right bundle to reach and cross the septum first. Of course, it would slow conduction in the right bundle as well, but if the left bundle were already diseased, ischemia would have a greater effect and slow it even more.
In these cases, the impulse arriving from the right ventricle can do two things: it can activate the LV by cell-to-cell conduction or it can quickly enter the posterior fascicle and finish by conducting in the Purkinje system. The latter option would lead to a shorter QRS than if the impulse traveled cell-to-cell. In this case the QRS is close to 0.12 seconds. This also implies that right-sided septal depolarization arrived on the left septal surface below the level of the bifucation of the main left bundle.
Also, entering the posterior fascicle immediately would result in the same changes on the ECG as an LAFB.
I certainly agree that the precordial leads don't have the typical appearance of a classic complete LBBB, but the typical appearance of a classic LBBB doesn't assume a massive MI occurring.
Normally we would expect large S waves in V1 - V3 in LBBB. But this is a very large, proximal LAD occlusion and terminal QRS distortion has resulted in the loss of S waves. The precordial QRS complexes are not nearly as large as we may be used to but I have seen plenty of LBBB tracings in which the precordial deflections were not large at all.
When the precordial deflections (mainly, the QRS intervals) are not as tall as we think they should be, don't forget to look at the mean QRS axis in 3-D. An axis that lies more in the frontal plane than in the horizontal plane will result in smaller deflections in the precordial leads. This occurs very frequently with emphysema.
I think the ECG demonstrates a very large acute MI due to a very proximal LAD occlusion. This has resulted in increased conduction delay in the left bundle branch leaving us with the appearance of LAFB and an interventricular conduction delay that looks more like LBBB than anything else - though certainly NOT a fixed LBBB.
Addendum: I also want to point out that ST depression is NOT part of LAFB morphology. The ST depression in leads II, III and aVF is reciprocal to the ST elevation in leads I and (especially) aVL.
Jerry W. Jones MD FACEP FAAEM
https://www.medicusofhouston.com
Twitter: @jwjmd