
Submitted by Dawn on Wed, 04/20/2016 - 23:07
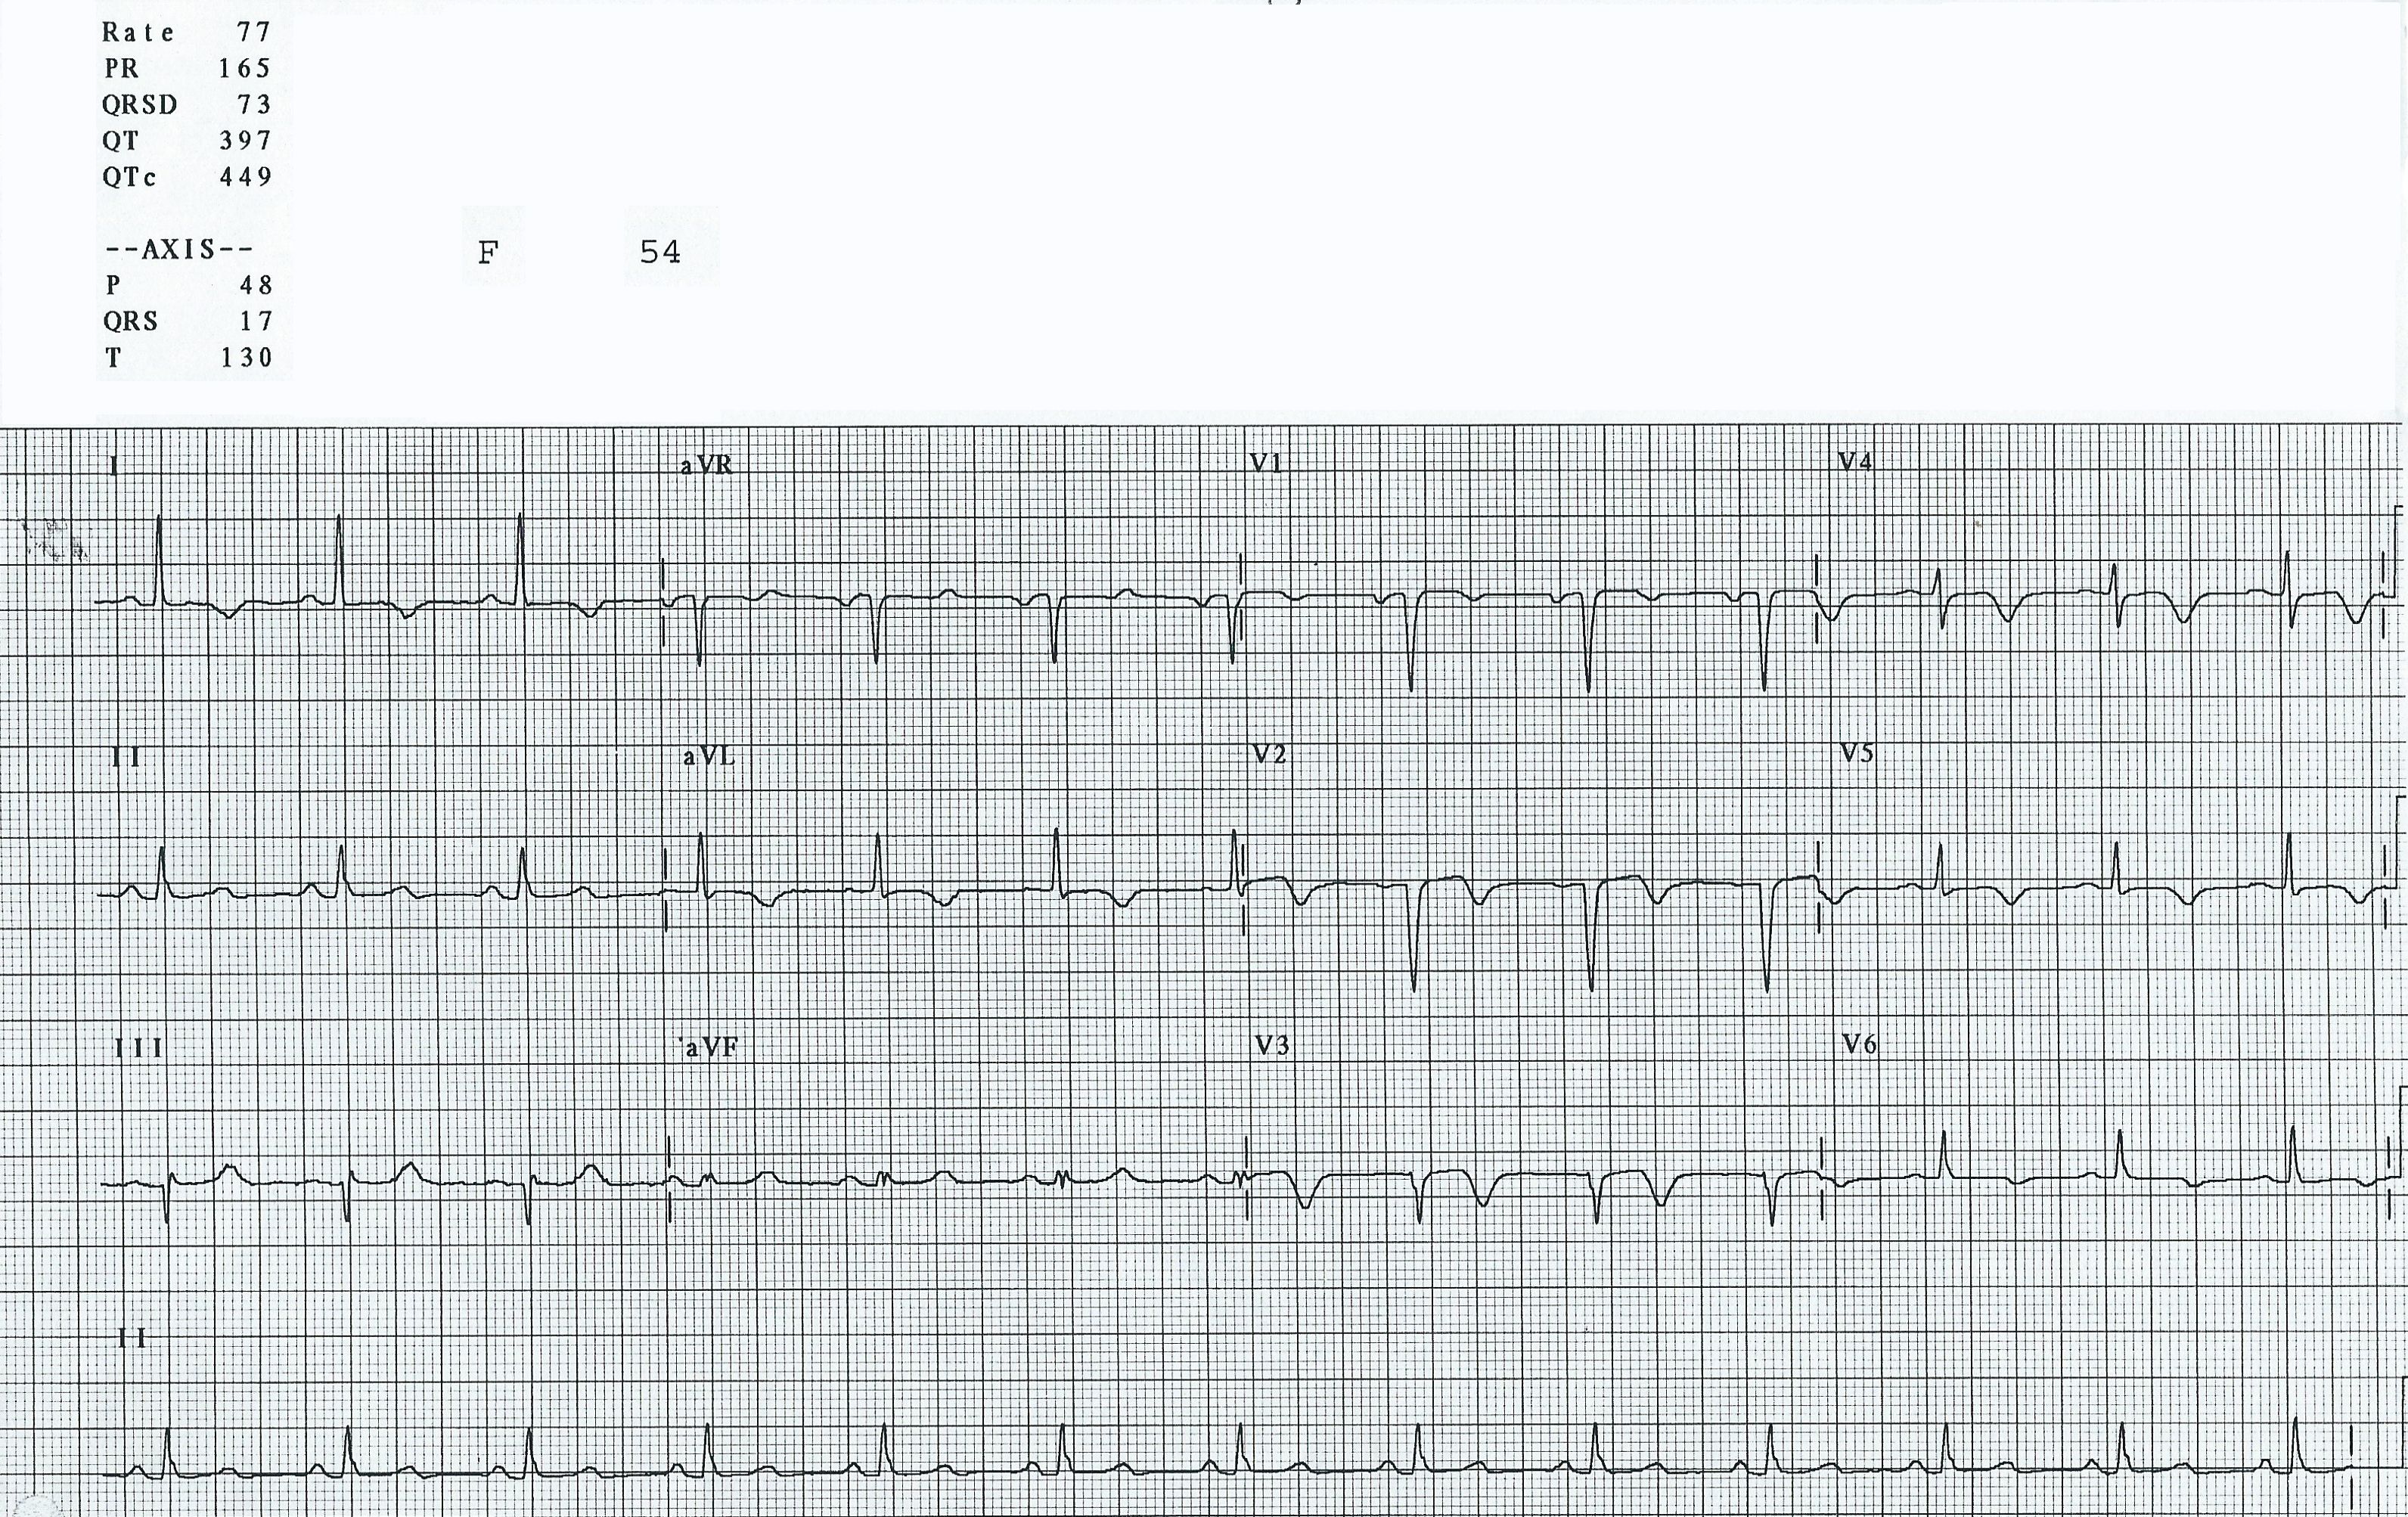
This ECG is from a 54-year-old woman who had an M.I. one week prior to this tracing. She did not receive interventional treatment, as it was not available where she lived when this happened years ago. Her ECG shows the signs of healing injury, as well as probable permanent damage.
Where was this M.I.? The affected leads are all of the precordial leads (V1 through V6), as well as I and aVL. The precordial leads reflect the anterior and low lateral walls of the heart, and Leads I and aVL show us the high lateral wall. This area is perfused by the left coronary artery, and she had a proximal lesion.
What ST and T wave changes are present? All of the leads listed above show a flattening of the ST segments. While they are no longer elevated (the acute injury is over), they are flat and almost convex upward. This shape is usually abnormal, and it has persisted even though the acute injury is subsiding. The T waves in the anterolateral leads are all inverted. This represents reperfusion of the injured tissue. Whether the offending clot is removed by invasive procedure, thrombolytic drugs, or natural degradation, the tissue that is still alive will reperfuse.
What else is abnormal? There are pathological Q waves in V1, V2, and V3, or we could say, "loss of normal r waves". Typically, precordial leads begin with an R wave. Lead V1 often has a small r wave, and the size of the R waves progresses across the chest until V6 is almost entirely upright. This is termed "R wave progression". Loss of the initial R wave in the right-sided chest leads is not always indicative of a "pathological Q wave". Also, a small "septal" q wave can sometimes be seen in V5 and V6. True pathological Q waves represent permanently damaged, necrotic myocardium. Poor R wave progression can be a result of pathological Q waves, or other conditions, including incorrect electrode placement. In this ECG, there appears to be a pathological Q wave in Lead III, as well, but isolated Q waves are not uncommon in Lead III, and this patient's current problem is a resolving anterolateral M.I. We don’t know this patient’s clinical status, but we do know that she was still hospitalized, and in the intensive cardiac care unit.
Is there any good news? Well, this patient has survived a large and dangerous event so far. She is in normal sinus rhythm with a narrow QRS complex and normal intervals.
For a review of the coronary arteries’ distribution, please see the coronary arteries illustration in Heart Art.
Related Terms:
Rate this content:
All our content is FREE & COPYRIGHT FREE for non-commercial use
Please be courteous and leave any watermark or author attribution on content you reproduce.
Comments
Large Anterior MI AFTER the Event
An excellent ECG for discussion is presented in this case. We know that this woman had her acute event approximately 1 week prior to this ECG. But this identical ECG picture could have been obtained a few days, weeks, months or even years after her event. There is simply no way of knowing from looking at this single tracing alone. What can be said — is that this patient is almost certainly past the “early acute period” (ie, the first 12 hours or so … ) because: i) she has developed infarction Q waves; ii) ST elevation has essentially resolved; iii) reciprocal inferior ST depression is not seen; and iv) there is deep T wave inversion.
I’ll add the following points:
The infarction Q waves that we see in leads V1 and V2 are called “QS complexes”. Technically, a “Q wave” is the negative deflection that precedes the R wave; and an “S wave” is the negative deflection that comes after the R wave. But there is no R wave in leads V1 and V2 — so by default (since we can’t tell if the negative deflection we see comes “before or after”, because there is no positive deflection in these leads) — the QRS appearance we see here in leads V1,V2 is best described as a QS complex.
There IS a small initial r wave in lead V3! I myself had to look 3 times to determine this — but the very first deflection in lead V3 is a tiny-but-present upright deflection (See my magnified figure). That there is a small initial r in V3 is not a clinically important distinction — since we already KNOW this patient had a large anterior infarction. My reason for bringing this point out is to emphasize the need for carefully scrutiny of complexes in ECG interpretation. And, sometimes I myself find it difficult to be certain of what the very first deflection in a given lead is … though careful scrutiny goes a long way toward clarifying what is occurring.
Most of the time, one will see small initial r waves in leads V1,V2 that gradually (and progressively) increase in amplitude as one moves across the precordial (chest) leads toward leads V5-to-V6. R wave amplitude progressively increases, until “transition” occurs (which is normally seen between leads V2-to-V4). The R wave often “tops out” by V5, and then decreases in height by V6 — though many variations of this progression are possible. It is important to appreciate that in an otherwise normal ECG — that lack of any r wave in leads V1 and V2 is not necessarily indicative of prior infarction (could be due to anatomic variant, chest wall appearance, lead placement, LVH, etc). That is not true in this case, however — since the dramatic ST-T wave changes we see clearly define the QS complexes in V1,V2 as infarction Q waves (and the rS we see in V3 as an “infarction equivalent”). Transition is delayed here (occurs between V4-to-V5) — with the relatively small R wave amplitude in V5,V6 almost certainly the result of “loss of R wave amplitude” from this extensive anterolateral infarction.
It is important to emphasize that this ECG does not represent “Wellens Syndrome”, despite the shape of the ST-T waves in mid-anterior leads that resembles what is seen with Wellens Syndrome. That’s because Wellens’ syndrome is an ECG pattern that predicts a high-grade proximal LAD (Left Anterior Descending) artery narrowing before infarction has taken place. Diffuseness of the changes seen here with anterior Q waves tells us these are reperfusion ST-T waves and not Wellens syndrome!
Although described as “high lateral” leads — lead I and especially lead aVL provide perspective of anterior wall happenings. The finding of acute ST elevation in lead aVL in association with anterior ST elevation is often a strong clue to proximal LAD occlusion. In this case, the similar ST-T wave appearance in leads I and aVL as is seen in the chest leads is completely consistent with extensive anterior wall infarction from proximal LAD occlusion. Although there is no way to tell if the patient had preexisting multivessel disease, reasons why I doubt acute occlusion of the LCx (Left Circumflex) artery are: i) because to simultaneously involve the LAD and LCx generally means Left Main occlusion, which is usually a rapidly fatal condition; and ii) there are no Q waves in any of the lateral leads (I, aVL, V5, V6).
Final SUBTLE Point (this is beyond-the-core! ) — there is a Q wave in lead III. That is, there is a Q wave in the first and third complexes in lead III (there may be a tiny initial r wave in the middle complex in lead III). As an isolated finding, a Q wave in either lead III or in lead aVF is not necessarily indicative of prior infarction. Because leads III and aVF are inferior leads providing perspective of “the diaphragmatic area” — it is not uncommon to see small q waves come-and-go in these leads (as the diaphragm moves up and down during normal respiration) — and that is my suspicion for why the tiny r wave is intermittently seen here. My guess is that QRS appearance of lead III here is not the result of prior inferior infarction. Instead, the slight scooping of the ST segment in leads III and aVF with a “fatter”-than-I-would-expect T wave in these leads probably reflects reciprocal change (Isn’t the lead III ST-T wave a “mirror-image” of the ST-T wave in lead aVL! ) in this “reperfusion” stage of this large anterior infarction.
--------------------------------------
NOTE: For more on assessment of normal and abnormal QRST Changes — Please check out my hour-long ECG Video on this topic at — www.qrstecg.com — (If you click on SHOW MORE under the video, you’ll find a detailed linked Contents that will allow you to jump to whatever topic is of interest to you).
Ken Grauer, MD www.kg-ekgpress.com [email protected]